/
Custom JQL Options
Custom JQL Options
- Old Street Apps (Unlicensed)
Owned by Old Street Apps (Unlicensed)
Jul 19, 2020
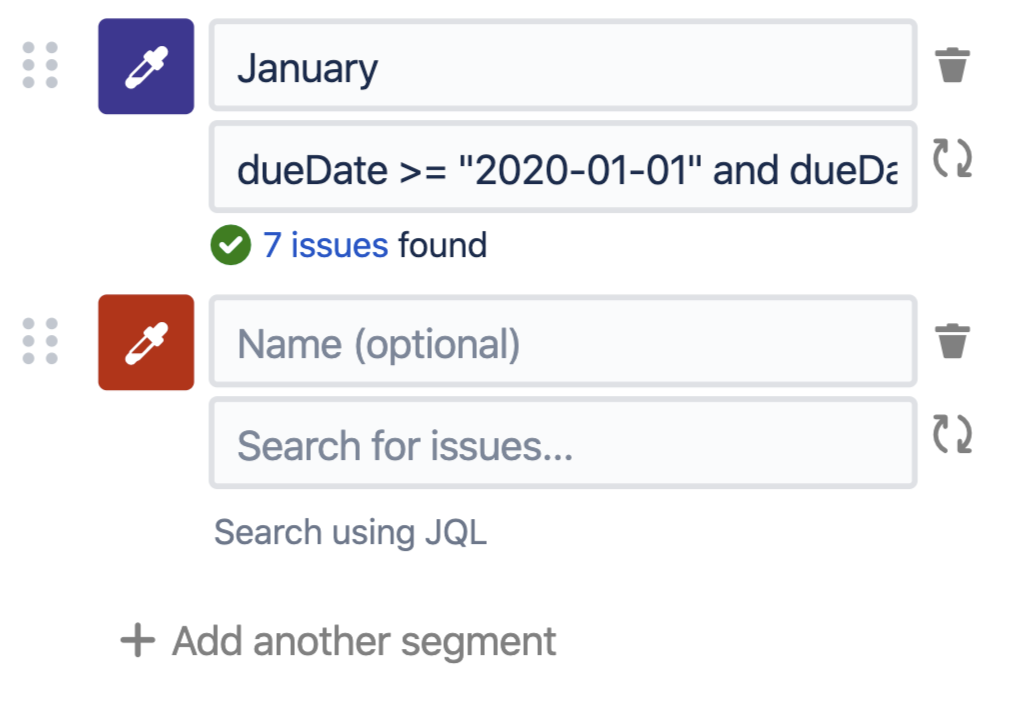
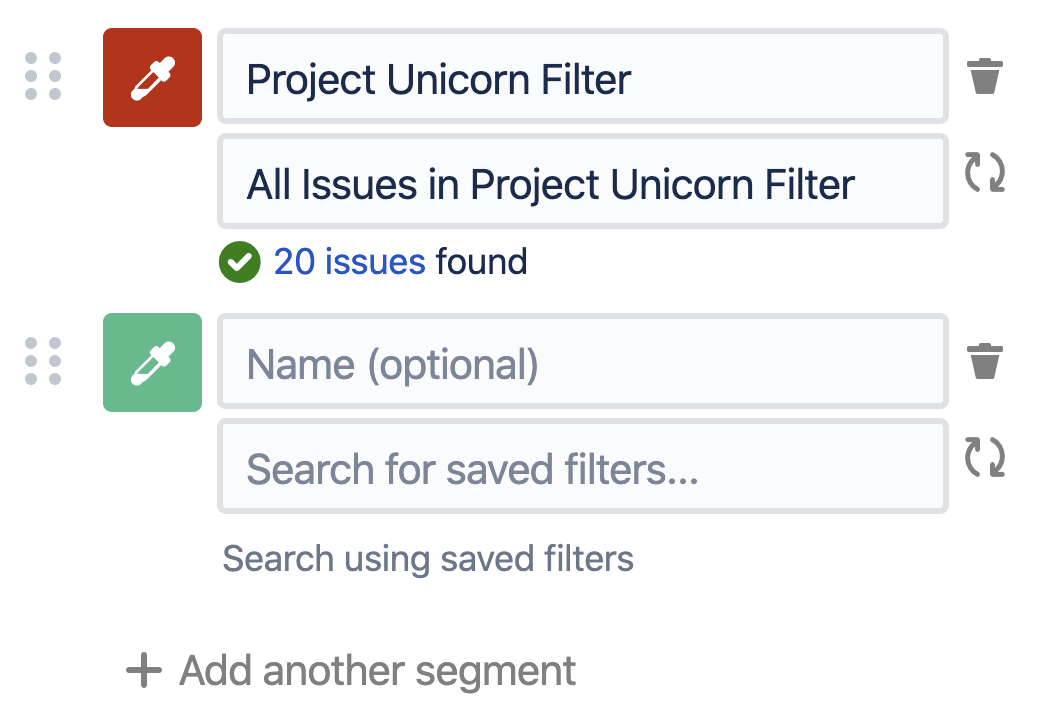
To create fully custom charts you can use the advanced options Custom JQL or Saved filters to create segments.
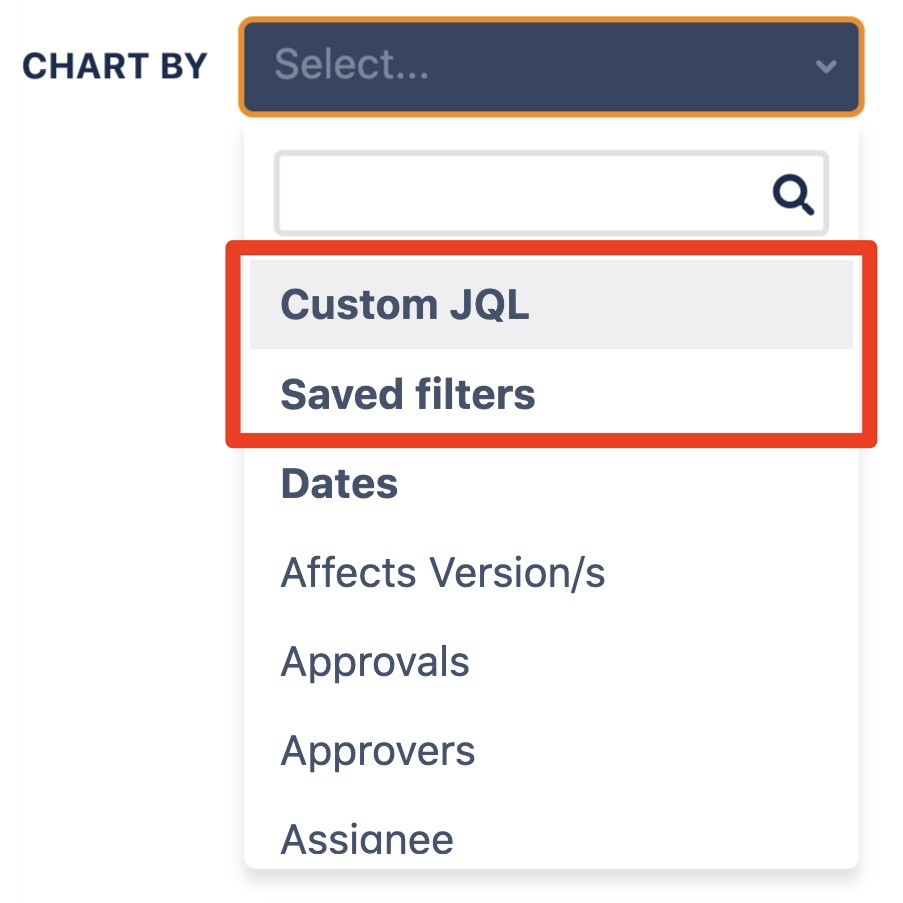
| Custom JQL | Saved Filters |
|---|---|
|
|
Unable to render {include} The included page could not be found.
Unable to render {include} The included page could not be found.
, multiple selections available,
Related content
Custom JQL Options
Custom JQL Options
Read with this
JSM Customer Portal Reports
JSM Customer Portal Reports
Read with this
Using ScriptRunner Enhanced Search with Custom Charts for Jira (Cloud)
Using ScriptRunner Enhanced Search with Custom Charts for Jira (Cloud)
More like this
Integration: Using ScriptRunner Enhanced Search with Custom Charts for Jira (Cloud)
Integration: Using ScriptRunner Enhanced Search with Custom Charts for Jira (Cloud)
More like this
Chart By and Group By Dropdowns
Chart By and Group By Dropdowns
More like this
Field Support
Field Support
More like this