/
Getting Started
Getting Started
- Old Street Apps (Unlicensed)
- Becky Schwartz (Unlicensed)
Owned by Old Street Apps (Unlicensed)
Last updated: Aug 09, 2022 by Becky Schwartz (Unlicensed)
Custom Jira Charts for Confluence has identical functionality on Cloud, Server and Data Center.
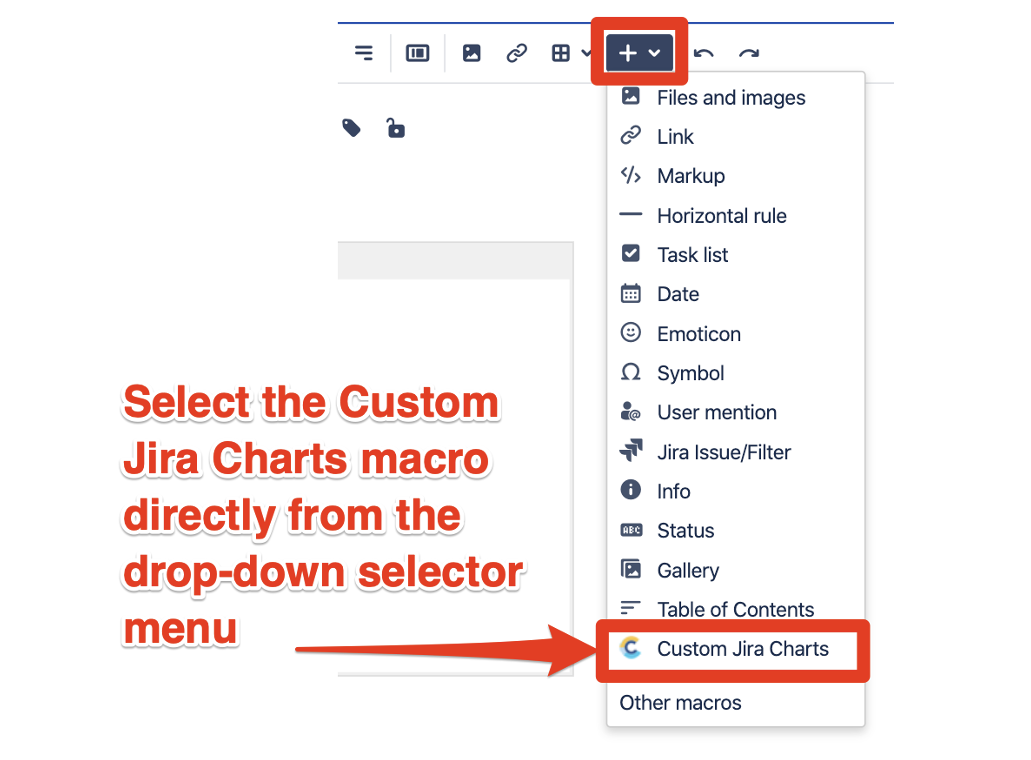
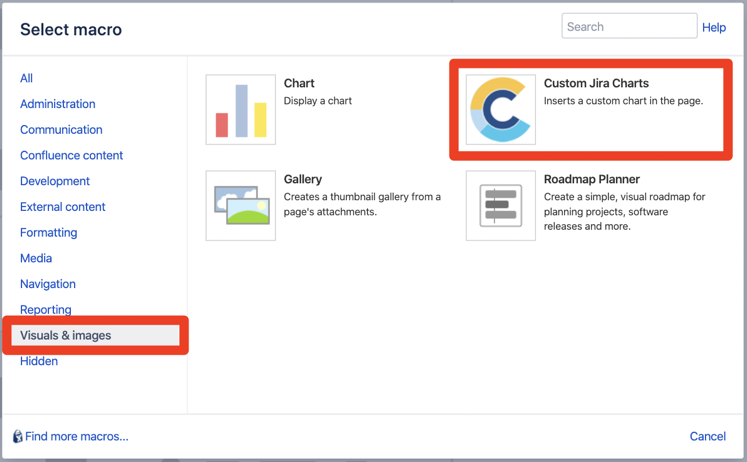
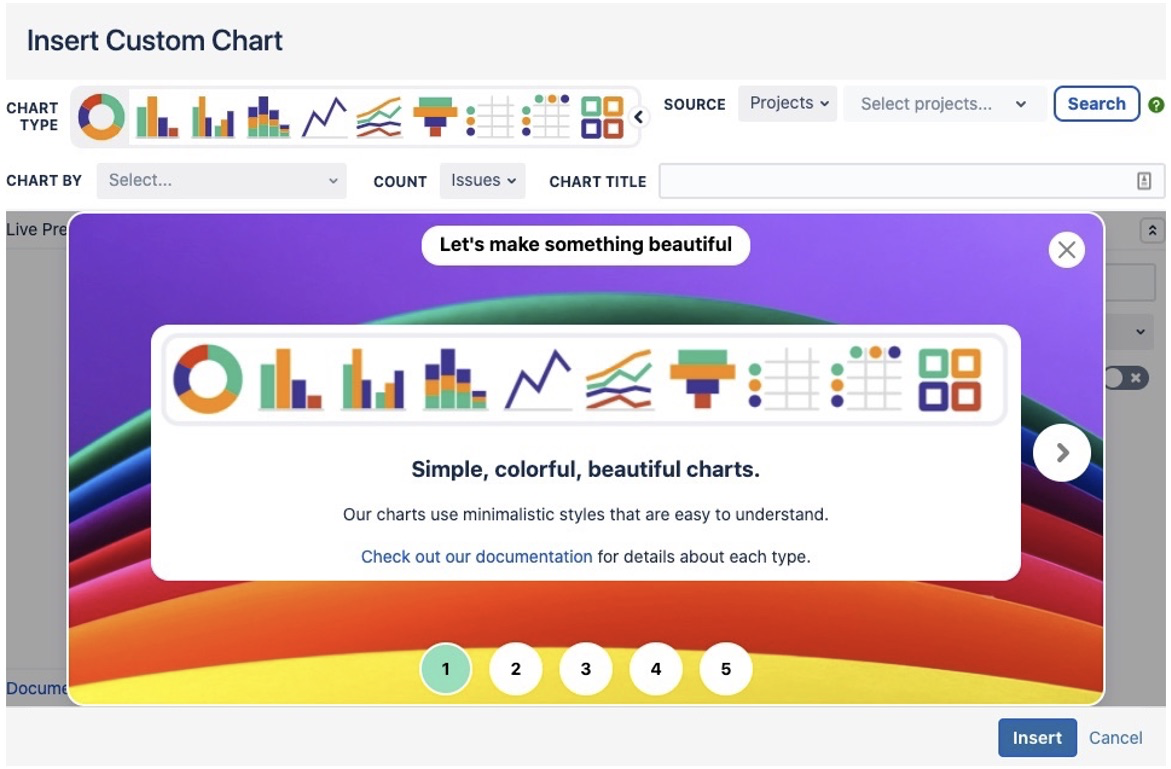
Insert the Custom Jira Charts macro on a Confluence page
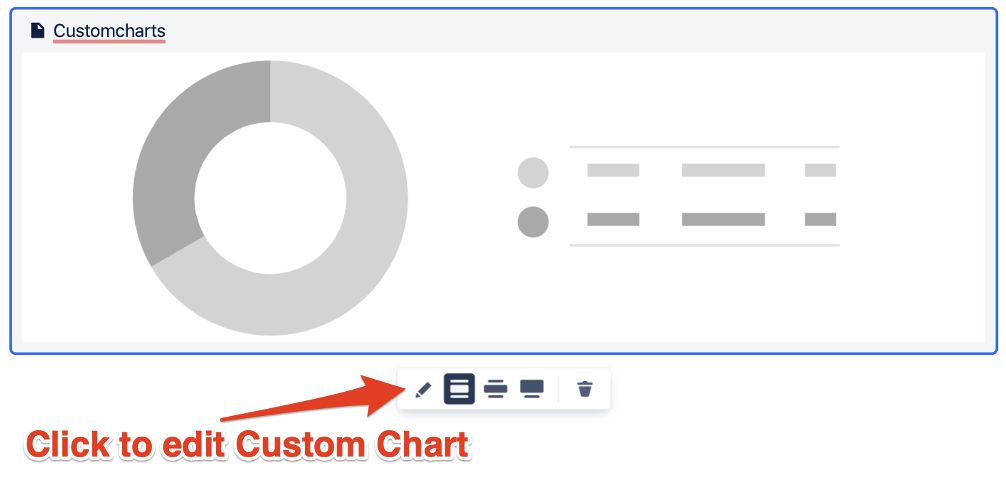
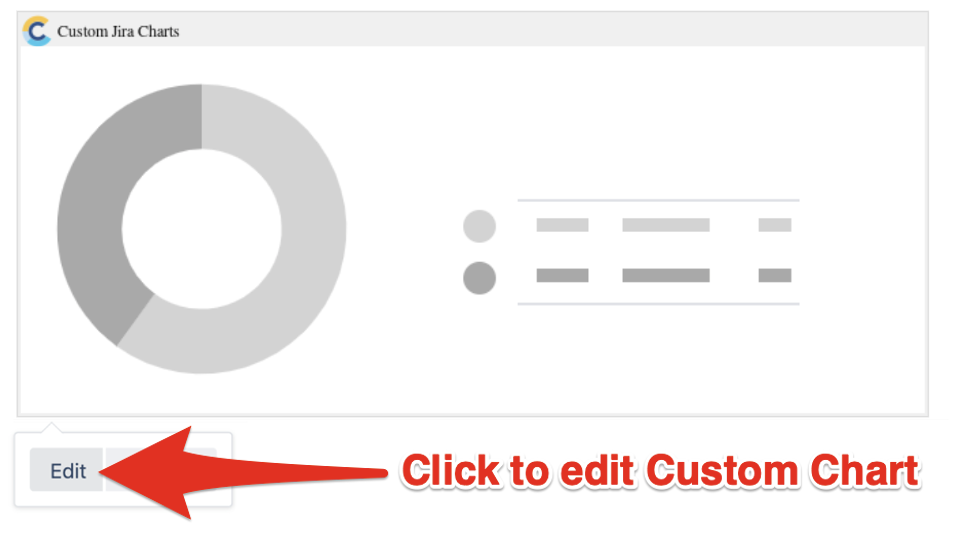
Click on the Custom Jira Charts macro to open the editor
| Cloud Editor | Server & Data Center Editor |
|---|---|
|
|
⠀
Start by selecting a Project, Saved filter or JQL query into the Source input to find your issues
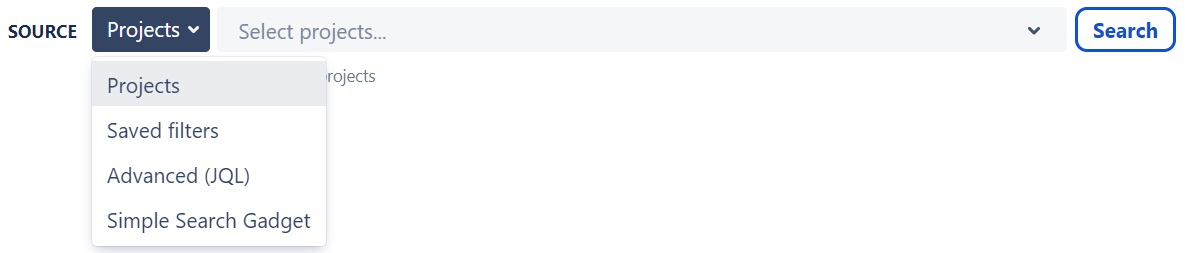
If you need some help writing your JQL query check out our quick getting started guide
Try using a Simple Search macro to to share a dynamic filter across multiple Custom Charts
⠀
Choose from a wide range of Chart Types

⠀
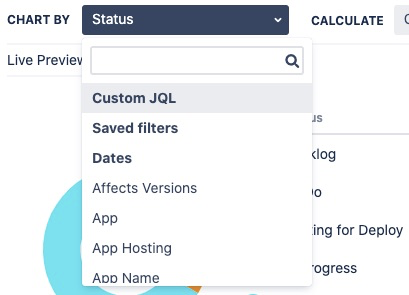
Next, select your Chart By option from the drop-down list and choose a Calculate option

⠀
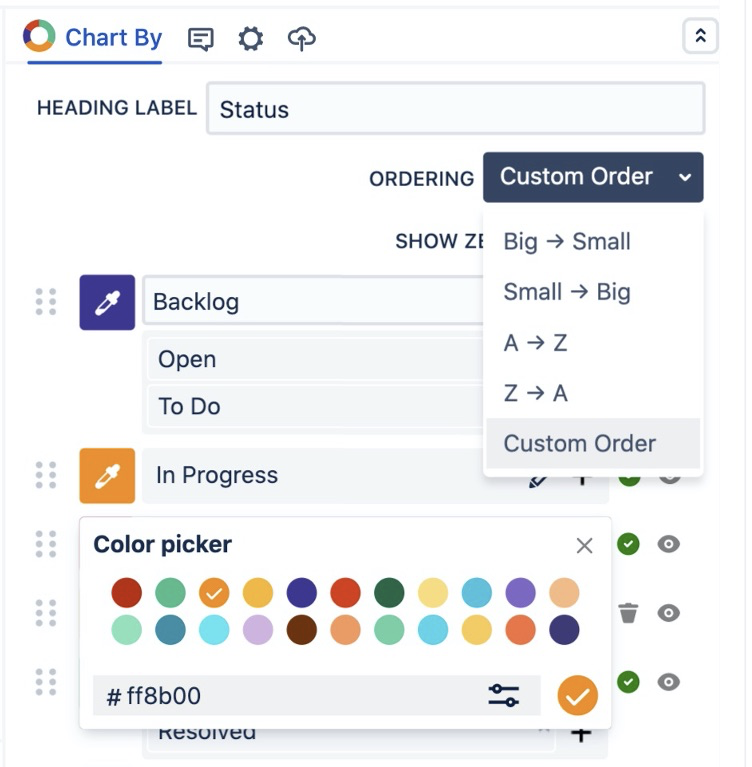
Customize the segment order and colors of your charts
⠀
The show/hide selector allows you to hide segments that you don't want to display on your charts
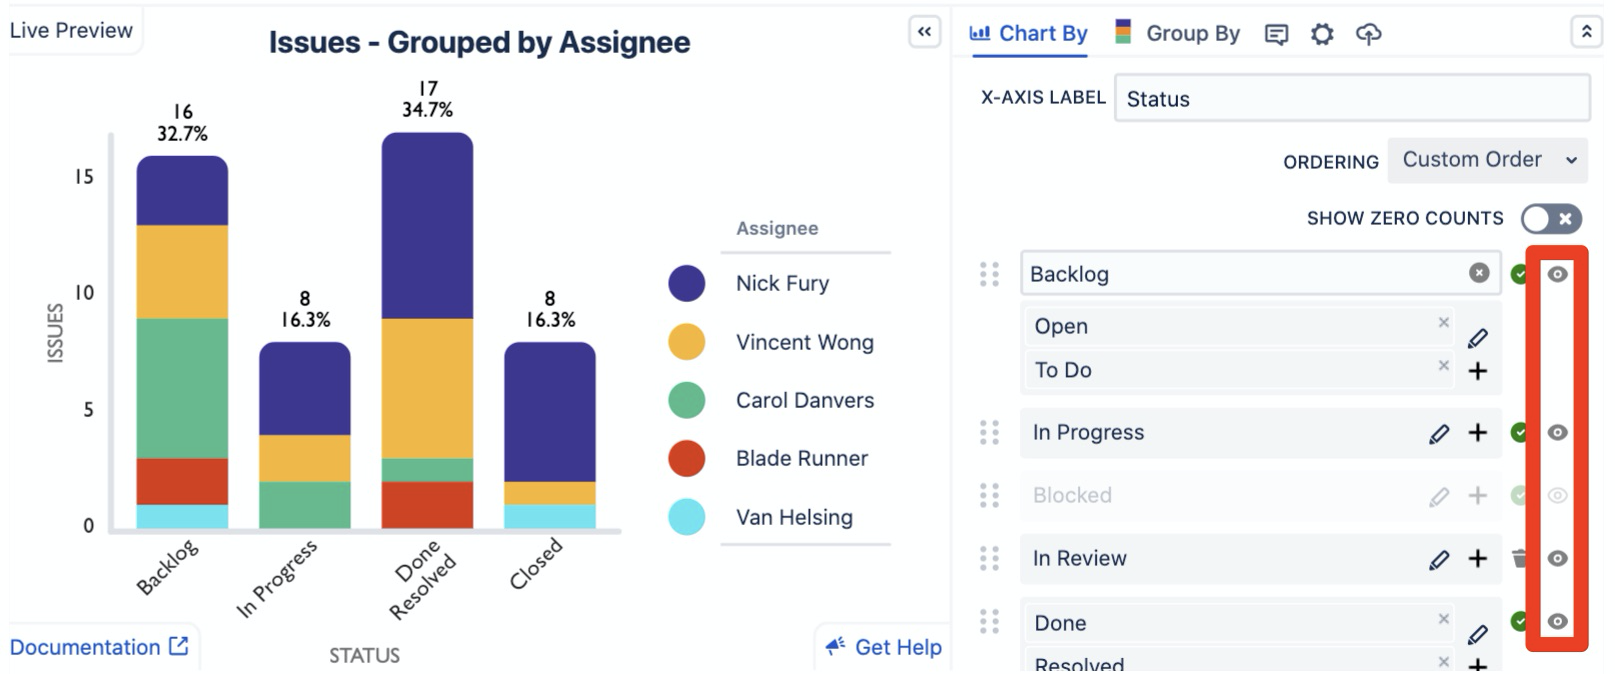
⠀
Edit the name of any segments using the pencil icon that appears when you hover over an option
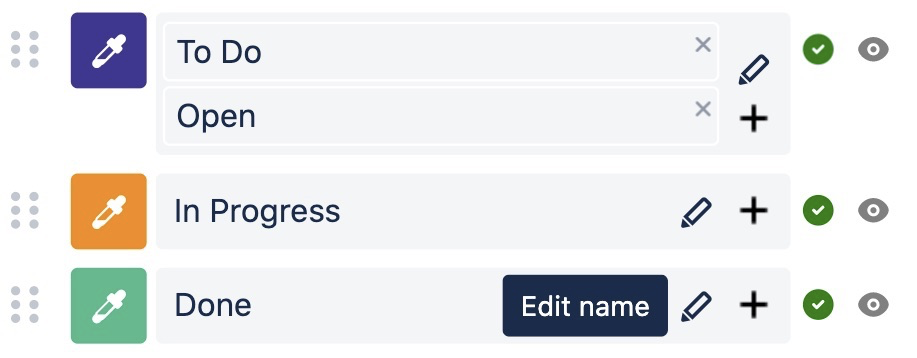
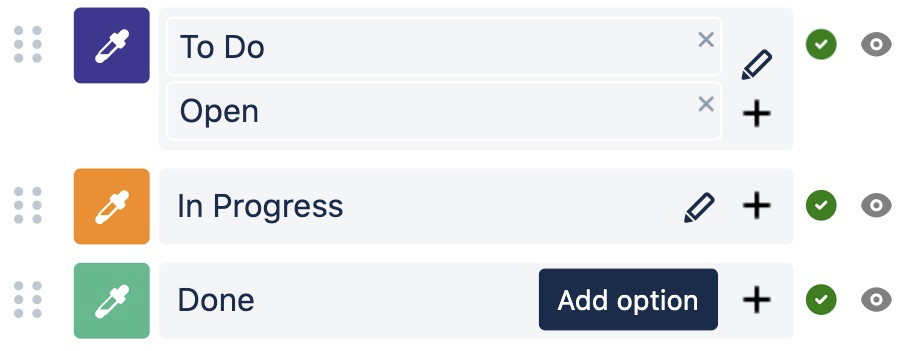
Merge multiple options into a single segment using the plus icon next to each segment
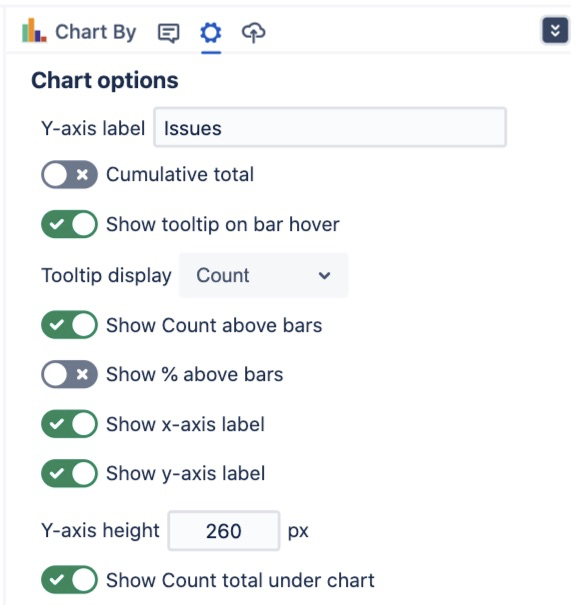
Use the Display Options to further customize your charts
For even more customization of your charts use Chart By Custom JQL or Saved filters
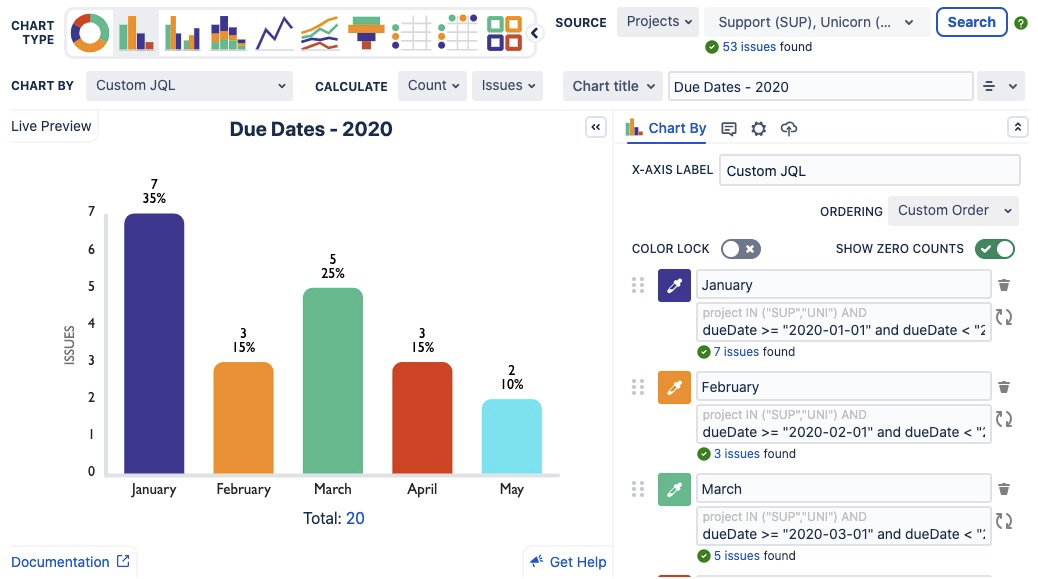
Each segment is now an individual JQL search which means you can chart by anything that you can write a JQL search for!
Unable to render {include} The included page could not be found.
Unable to render {include} The included page could not be found.
, multiple selections available,
Related content
Connect to Jira
Connect to Jira
Read with this
JSM Customer Portal Reports
JSM Customer Portal Reports
Read with this
Example Reports - Use Cases
Example Reports - Use Cases
Read with this
User Impersonation
User Impersonation
Read with this
Single Date Field Options
Single Date Field Options
Read with this