Skip to end of metadata
Go to start of metadata

You are viewing an old version of this page. View the current version.

Compare with Current View Page History

« Previous Version 45 Current »

FAQ Categories


General Questions

 How does Custom Charts work?

Custom Charts provides dashboard gadgets and Confluence macros that allow you to add dynamic charts that look great and are easy to build.

To get started, walk through our quick how-tos on creating and managing your charts:

 How actively is Custom Charts being developed?

Very actively! We have a whole development team dedicated to building and supporting Custom Charts.

You can follow our latest updates on Twitter.

 Does Custom Charts have a public feature roadmap?

Yes, we do! You can follow all our recent releases and upcoming features on our actively maintained public feature roadmap.

If you’re looking for a feature and don’t see it on the roadmap, let us know. We regularly incorporate customer feedback into our development backlog - some of the best parts of the app came from requests from people like you!

 I need help building a chart, who can I contact?

If you'd like to ask us a question about Custom Charts, please raise a ticket in our support portal or send an email to support@oldstreetsolutions.com.

Please let us know if you find a bug with our apps so we can fix them as soon as possible!

Our support team is here to help (smile)

 Which Jira fields are supported by Custom Charts?

Chart By Options - Supported Fields

Jira Service Desk Fields

The following Jira Service Desk fields are supported in Custom Charts

JSD FieldJira CloudJira Server & Data CenterNotes
Request Type(tick)(tick)Supported
Request Channel Type(tick)(tick)Supported

Request Language

(tick)(tick)Supported
Satisfaction Rating(tick)(tick)Supported
Organizations(tick)(tick)Supported
Approvers(tick)(tick)Supported
SLAs

(tick)

Using Custom JQL

Example 🔗

(tick)

Using Custom JQL

Example 🔗

Supported
‌‌ 


System Fields

The following Jira system fields are supported in Custom Charts

System FieldJira CloudJira Server & Data CenterNotes
Summary(tick)(tick)Supported
Assignee(tick)(tick)Supported
Creator(tick)(tick)Supported
Epic Link(tick)(tick)Supported
Epic Status(tick)(tick)Supported
Issue Type(tick)(tick)Supported
Priority(tick)(tick)Supported
Project(tick)(tick)Supported
Reporter(tick)(tick)Supported
Resolution(tick)(tick)Supported
Reviewed(tick)(tick)Supported
Status(tick)(tick)Supported
Status Category(tick)(tick)Supported
Labels(tick)(tick)Supported
Component/s(tick)(tick)Supported
Affects Version/s(tick)(tick)Supported
Fix Version/s(tick)(tick)Supported
Labels(tick)(tick)Supported
Sprint(tick)(tick)Supported
Story Points(tick)(tick)Supported
Epic Name(tick)(tick)Supported
Environment(tick)(tick)Supported
Security Level(tick)(tick)Supported
Created Date(tick)(tick)Supported
Updated Date(tick)(tick)Supported
Due Date(tick)(tick)Supported
Time Tracking(warning)(warning)Coming soon!
Work logged(warning)(warning)Coming soon!
Attachment(error)(error)Not currently supported
Description(error)(error)Not currently supported
Development(error)(error)Not currently supported
Epic Color(error)(error)Not currently supported
Linked Issues(error)(error)Not currently supported
Rank(error)(error)Not currently supported


Custom Field Types

The following custom field types are supported in Custom Charts

Custom Field TypeJira CloudJira Server & Data CenterNotes
Select List (single choice)(tick)(tick)Supported
Select List (multiple choices)(tick)(tick)Supported
Radio Buttons(tick)(tick)Supported
Check Boxes(tick)(tick)Supported
User Picker (single user)(tick)(tick)Supported
User Picker (multiple users)(tick)(tick)Supported
Labels(tick)(tick)Supported
Number(tick)(tick)Supported
Project Picker (single project)(tick)(tick)Supported
Version Picker (single version)(tick)(tick)Supported
Version Picker (multiple versions)(tick)(tick)Supported
Text Field (read only)(tick)(tick)Supported
Text Field (single line)(tick)(tick)Supported
Text Field (multi-line)(tick)(tick)Supported
Select List (cascading)(tick)(tick)Supported
Date fields(tick)(tick)Supported
Date and time fields(tick)(tick)Supported


Custom Fields - 3rd party apps

Many 3rd party apps are supported by Custom Charts.

If you find a custom field that isn't supported, please suggest a new custom field.


 Can my charts look at story points or other estimate fields?

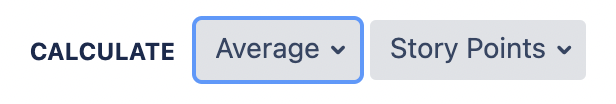
Yes! Custom Charts can calculate the sum of average any number field, including the out-of-the-box Story Points, Original Estimate, and Remaining Estimate fields, or any custom number field available in your instance. This option can be changed by selecting options from the Calculate dropdown available at the top of each chart.

 How can I export my charts?

All charts can be exported directly as PNG, PDF, and CSV.

Confluence

On Confluence Server & Data Center, exporting pages to PDF or Word will export all charts on the page.

On Confluence Cloud, exporting to PDF and Word requires a few extra steps in order to ensure that the export is accurate and secure. Charts must have User Impersonation enabled, and users must follow the instructions provided on this page:Cloud Page Export - PDF or Word to include the Custom Chart images in the export.

 How do I create a chart using a cascading select list?

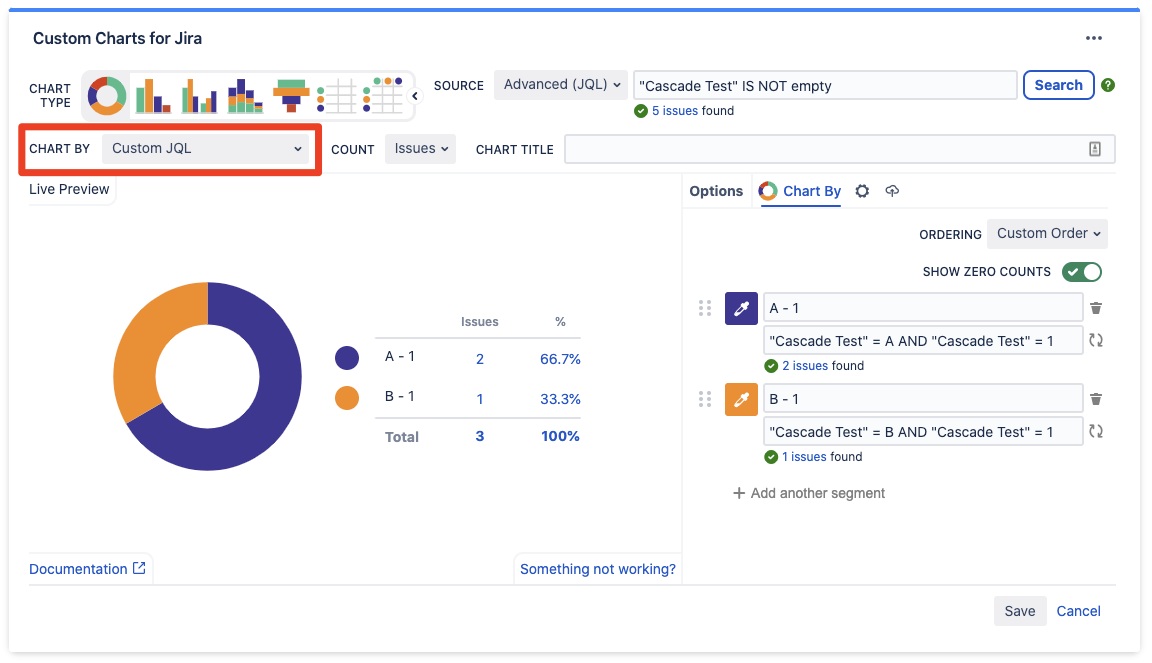
Currently, it is only possible to directly drive a chart with dynamic values from the first option in a cascading field. However, we do have a feature called Custom JQL that should allow you to build the charts you need. Here is an example that uses the JQL "Cascade Test" = A AND "Cascade Test" = 1 which will find only issues where the value of the cascading field is both A and 1.

 How can I display my Custom Charts in both Jira and Confluence?

No need to export static charts to display them elsewhere, Custom Charts for Jira and Custom Jira Charts for Confluence are two separate apps, allowing near-identical experiences so you can create beautiful reports in both places.

In Confluence you have extra functionality with User Impersonation, allowing you to do things like display reports in your Jira Service Management knowledge base.

 In future, my company plans to migrate from Server / Data Center to the Atlassian Cloud. Can Custom Charts be migrated to Cloud and are the features different on Cloud?

Custom Charts has identical features on Cloud, Server, and Data Center.

Migrating from Confluence Server & Data Center to Confluence Cloud works seamlessly. Simply export a page, space, or entire instance and import it to your Confluence Cloud site. When you install the Cloud version of the Custom Jira Charts for Confluence app your charts will be configured exactly as before.

Note: Charts with User Impersonation enabled will be imported with User Impersonation turned off. This is to ensure that Custom Charts are secure by default and, therefore, charts must be edited and re-assigned an Impersonation User after importing.

Migrating dashboards with custom gadgets from Jira Server & Data Center to Jira Cloud isn’t currently supported by Atlassian. This feature is a top priority for our development team and we are actively working with Atlassian on this functionality.

 How do I connect Simple Search to Custom Charts?

Once you’ve set up your Simple Search how you like it, the next step is to connect it to your Custom Charts so it knows which charts to filter.

To connect a Simple Search gadget to a Custom Chart:

  1. Add a Custom Charts for Jira gadget/macro to the page

  2. Edit your Custom Charts

  3. Select Simple Search Gadget/Macro from the Source dropdown selector

  4. Once selected, you’ll see the Reference ID from each Simple Search

    1. If you have multiple Simple Search gadgets on one page, simply edit the Simple Search to find the Reference ID


User Impersonation

 Is User Impersonation enabled by default?

No. By default, User Impersonation is disabled and no users have access to Impersonate themselves, or any other users.

To give users access to this feature individual users and/or groups must be added to the User Impersonation Permissions in the Custom Jira Charts administration settings.

 How is User Impersonation secured? What is a "Unique Hash" for User Impersonation?

When a user builds a Custom Jira Chart in the Confluence editor and clicks Insert or Save a number of very important steps happen:

  1. The User Impersonation permissions of the user are checked again to ensure that they still have the correct permissions to create a chart impersonating the selected user

  2. Every parameter from the chart is used to generate a unique hash. This includes:

    1. The source JQL or Saved Filter for finding issues

    2. The Chart By and Group By field selections

    3. All segment configuration (color, names, order, etc.)

    4. The page ID of the page the chart is being created on

  3. This hash is sent to the database

    1. On Confluence Server and Data Center this is the same database as your Confluence instance

    2. On Confluence Cloud, this hash is stored on the Custom Jira Charts database

This means that, if anyone attempts to change anything about the chart, even the color of a segment, the hash that is created won’t match the has stored in the database and there will be an error.

User Impersonation is secure by design so that only the Jira data specified by the creator of the chart is displayed.

 Who can view a Custom Jira Chart when User Impersonation is being used?

When User Impersonation is enabled, anyone who has the View permission on the Confluence page will be able to view the Custom Jira Chart.

This means that anyone who can view the Confluence page, even Confluence users without Jira licences are able to view the Custom Jira Chart.

If your Confluence instance has public access enabled then User Impersonation will also allow anonymous users to view charts on pages where the anonymous view permission is enabled

 Can someone without the right permissions edit a chart I've created?

No. When a chart with User Impersonation is saved, a unique hash is generated specifically for that chart configuration. This unique hash means that there can be no changes made to the chart unless the user trying to edit the chart has the correct permissions. If a user without the correct User Impersonation permissions tries to edit a chart, this is the message they will see:

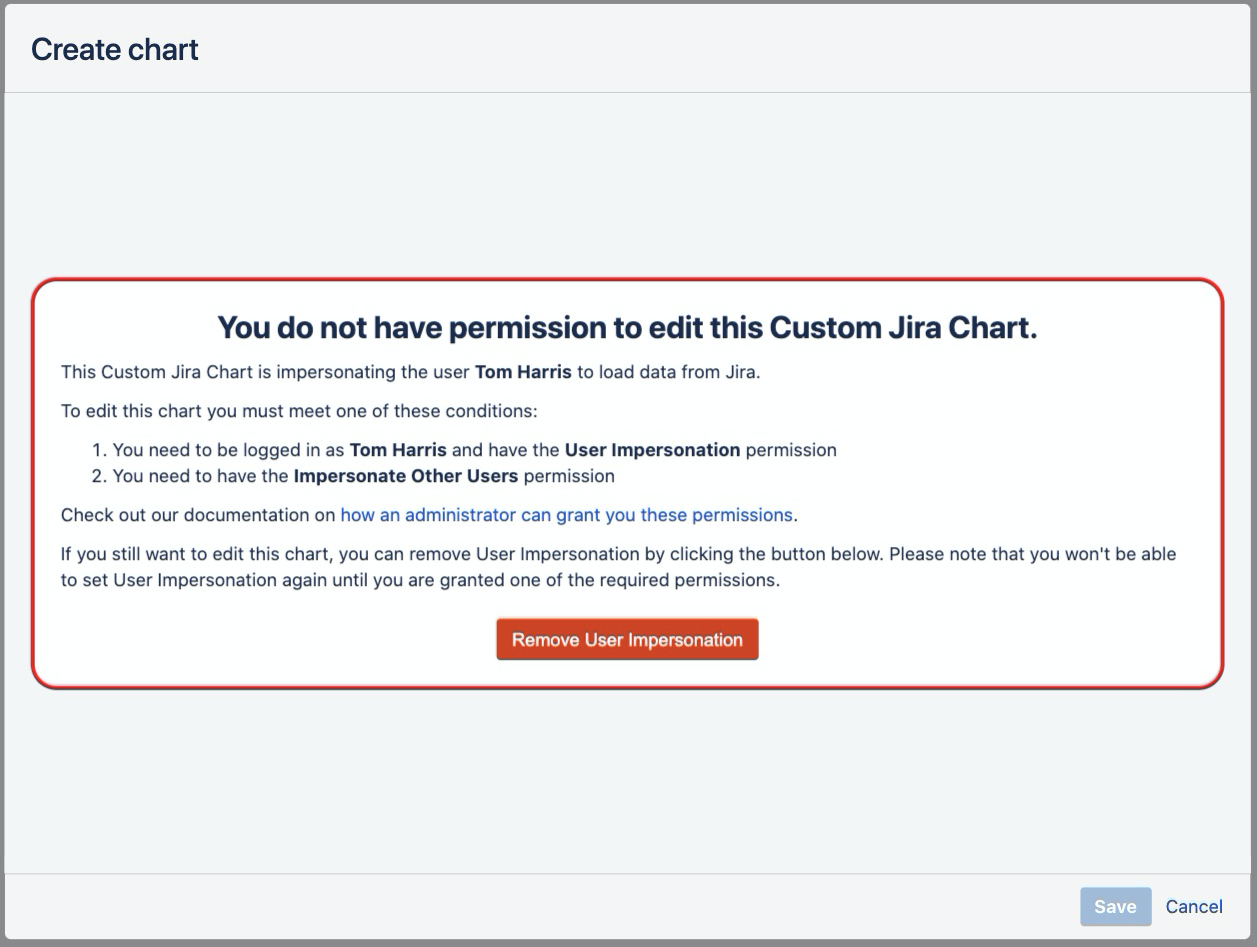
If a user clicks “Remove User Impersonation” then the chart will revert to the default setting of no impersonation and load the data as the current user.

 Does User Impersonation work with the Simple Search macro?

No. When the data source for a Custom Jira Chart is a Simple Search macro then User Impersonation is disabled. This is because the Simple Search macro allows for arbitrary JQL to be run which would bypass the security restrictions we have built for User Impersonation, allowing any user viewing the chart to write any JQL query.

This is something we are looking to improve in future but for now, this feature is disabled.

 If a chart is copied to a different page with User Impersonation enabled will it still work?

No. A chart created with User Impersonation will only have User Impersonation enabled for the specific Confluence page on which it was created. This is because of the unique hash that is associated with the chart is related to the Confluence page ID. Therefore, if the page ID changes because the chart is copied to a new page, then the unique hash will no longer match what is stored in the database and the chart will revert to the default setting of no impersonation and load the data as the current user.

This means that, if you copy the chart to a new page it will keep all the configuration (JQL, colors, title, etc.) but it will switch back to the default setting of no impersonation and load the data as the current user.

Security, Data and Permissions

 What permissions does Custom Charts for Jira Cloud require?

Act on a user's behalf, even when the user is offline

  • When Custom Charts loads issue data from Jira into the charts, it goes via our servers to perform the calculations to generate the charts

  • We don’t store any issue data on our systems, it just passes through for the calculations

  • So we’re actually only using the first half of the permission “Act on a user's behalf” because we make the requests to Jira as your user

  • This makes sure all Jira user permissions are respected so that each user who views the charts is only shown data that their user is allowed to see

  • We don’t currently use the “when the user is offline” part of the permission so you don’t have to worry about anything changing

  • Custom Charts makes no changes to any data, it only displays data

Write data to the host application

  • This permission allows Custom Charts to save the gadget configuration to your Jira instance

  • This helps to improve security as it means all configuration data for individual charts are stored on your Jira instance by Atlassian

Read data from the host application

  • This permission allows Custom Charts to read the gadget configuration we saved with the write permission so that we can load the Custom Charts

  • It also allows Custom Charts to read the list of custom fields on your instance, so when you’re in the Custom Charts editor you can use the dropdown field picker for “Chart By” and “Group By”

 What permssions does Custom Jira Charts for Confluence Cloud require?

Read data from the host application

  • This permission allows Custom Charts to read the content of the page the macro is on to allow the Simple Search macro to look for Custom Jira Charts on the same page and dynamically update the search results.

 What issue data is stored by Custom Charts?

No issue data is stored on our servers. We don’t store any issue data on our systems, it just passes through for the chart calculations.

 Where are the Cloud servers located for Custom Charts?

Custom Charts for Jira (Custom Charts) is hosted and managed within Amazon’s secure data centers and utilizes the Amazon Web Service (AWS) technology. The Amazon servers are located in Germany.

Amazon has published security statements that you can find at the following link: https://aws.amazon.com/security

 For Server & Data Center is any outside connection required to use Custom Charts?

No. Custom Charts for Server & Data Center are completely stand-alone applications that require absolutely no outside connection to function.

 My company accesses Atlassian Cloud using a VPN or Corporate Network / firewall. Will Custom Charts Cloud still work?

Yes. If you are using Atlassian Cloud Jira and/or Confluence you should be fine using Custom Charts. If you experience any problems it is usually caused by your VPN or Corporate Network / firewall blocking access to our servers.

Ask your IT teams to ensure that access to these URLs is unrestricted:

Licencing and Pricing Questions

 We have a monthly Cloud subscription to Jira and/or Confluence. How do I buy a Custom Charts licence?

As long as you have a valid payment method associated with your Atlassian account, at the end of your free trial your full subscription will begin automatically.

If you have any questions about this process please contact us at support@oldstreetsolutions.com

 We have an annual Cloud subscription to Jira and/or Confluence. How do I buy a Custom Charts licence?

If you have an annual Cloud subscription then you will need to purchase an annual licence for Custom Charts. If you have other add-ons then you should have been through this process before.

  • If you have an Atlassian partner that purchases your licences then they will be able to help you with this

  • If you buy your licences directly from Atlassian then you will need to contact them to get a quote for an annual licence for Custom Charts

If you have any questions about this process please contact us at support@oldstreetsolutions.com

 We are on a Server / Data Center licence for Jira and/or Confluence. How do I buy a Custom Charts licence?

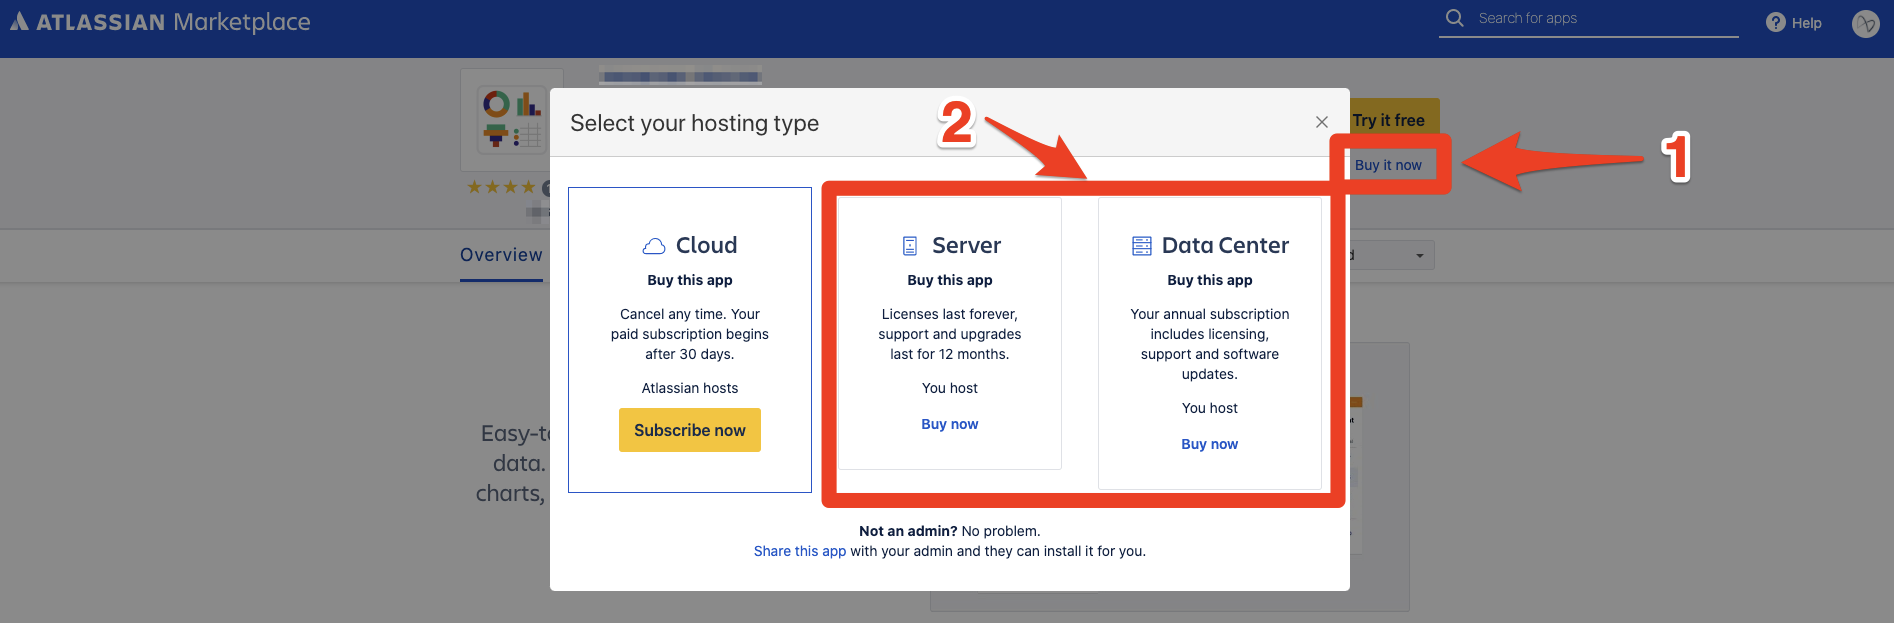
Navigate to the Marketplace listing, click “Buy it now” and select the hosting type you are using.

⠀⠀

 Can I try Custom Charts before I buy it?

Yes! You can get a trial from the marketplace to test the app before you buy it.

Additionally, we do have the Reporting Playground available on our website that allows you to view and edit sample charts.

 My instance has 500 users but only 10 need to use Custom Charts. Can I get a licence just for those 10 users?

The licencing of apps is controlled by Atlassian. You must purchase the license tier that matches the number of users you have licensed for your host product. For example, if you have a 25-user Confluence license, purchase the Confluence app at the 25-user tier. The app will only function if its license matches or exceeds the tier of the host product – even if only some of your licensed users need to use the app.

For Jira, you must purchase the app license that matches the highest Jira application tier. For example, if you have a 500-User Jira Software license, and a 20-Agent Jira Service Desk license, your Jira apps must be at the 500-User level. 

 What happens when my trial expires?

All your existing Custom Charts will continue to load.

When your trial expires you will no longer be able to edit any existing charts or create new charts until you purchase a valid licence.

 What happens when I uninstall the app?

If you uninstall and re-install Custom Charts no chart data will be lost as it is saved directly to dashboards and pages.

 Can I get a discount?

If you would like to discuss a discounted price please contact us at support@oldstreetsolutions.com

 I need help purchasing my licence, do you know any Atlassian partners that could help?

Yes! Please contact us at support@oldstreetsolutions.com and we can introduce you to our global partner network.


Blogs, Examples and User Case Studies

If you'd like to ask us a question about this app please raise a ticket in our support portal or send an email to support@oldstreetsolutions.com

Please let us know if you find a bug with our apps so we can fix them as soon as possible!

Our support team is here to help (smile)


Old Street Solutions Ltd. © 2021
  • No labels