Hidden_Getting Started
- Old Street Apps
- Morgan Folsom (Unlicensed)
- Anonymous
Owned by Old Street Apps
Custom Charts for Jira has identical functionality on Cloud, Server and Data Center.
Insert the Custom Charts gadget on a Jira dashboard
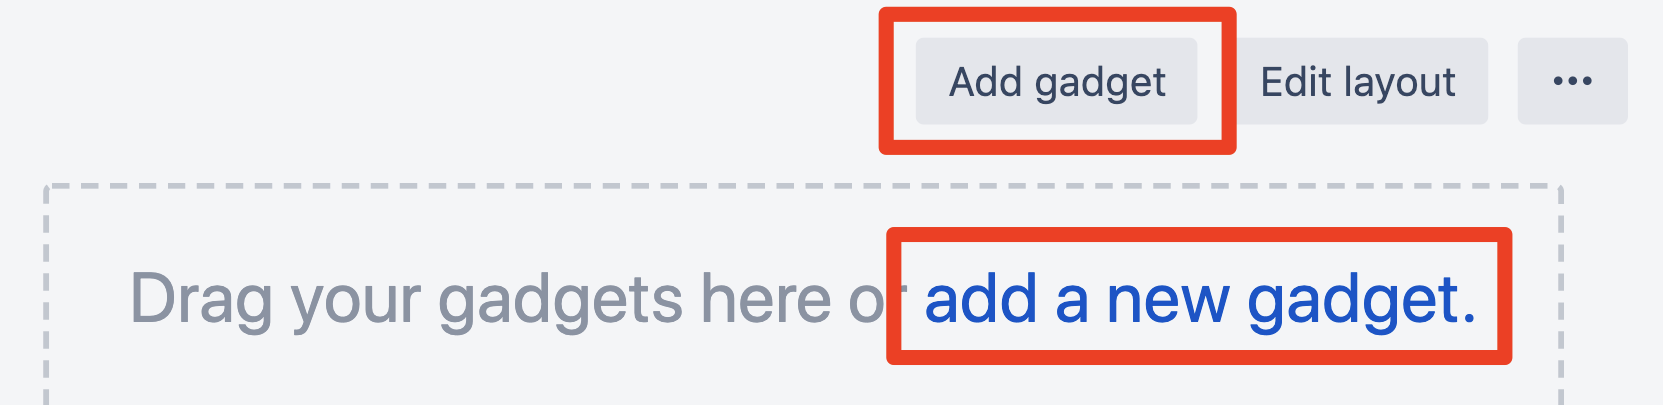
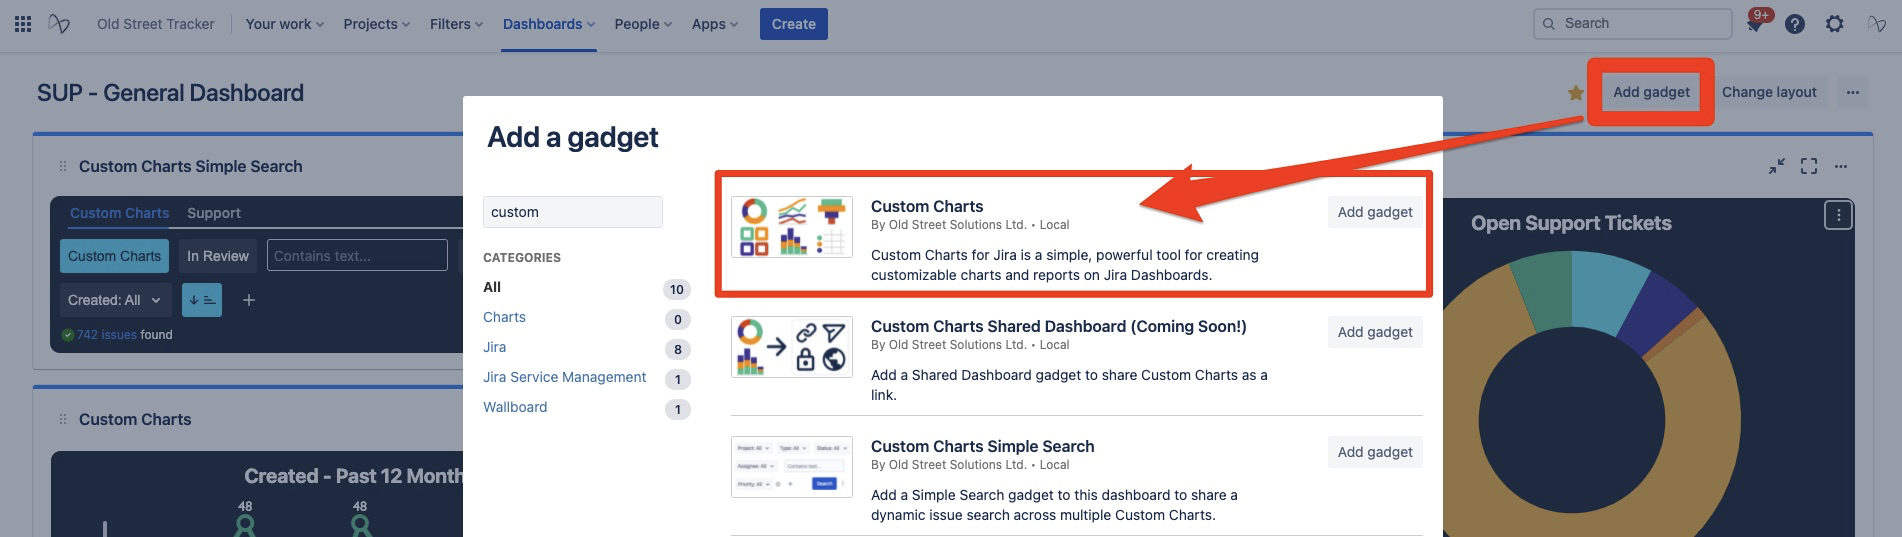
The Custom Charts for Jira gadget will be added to the dashboard with the editor open
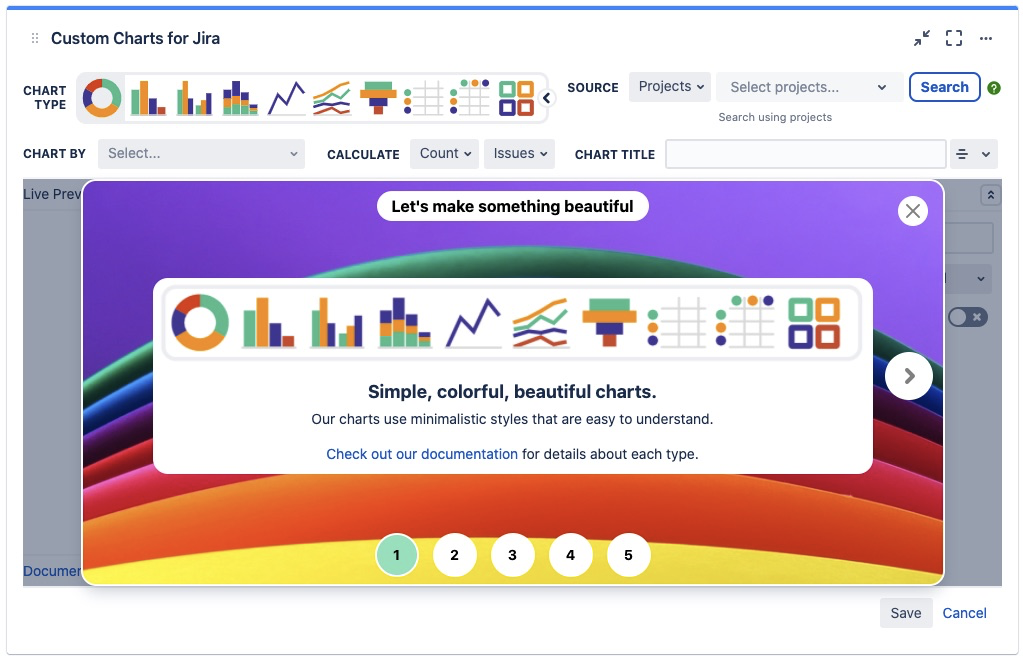
Start by selecting a Project, Saved filter or JQL query into the Source input to find your issues
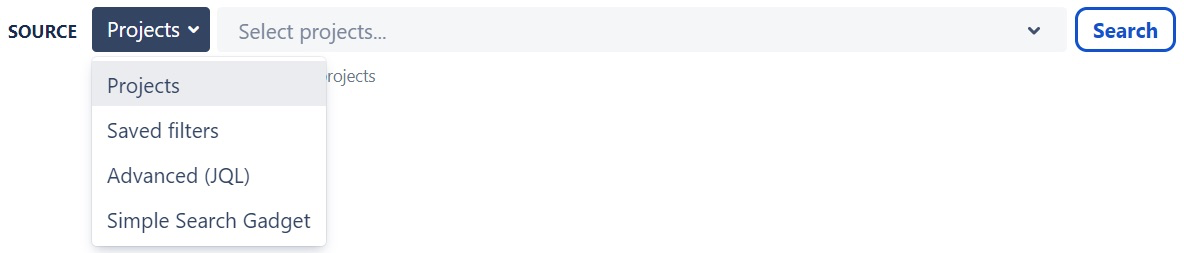
If you need some help writing your JQL query check out our quick getting started guide
Try using a Simple Search gadget to to share a dynamic filter across multiple Custom Charts
⠀
Choose from a wide range of Chart Types

⠀
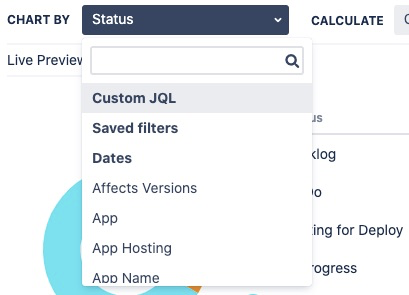
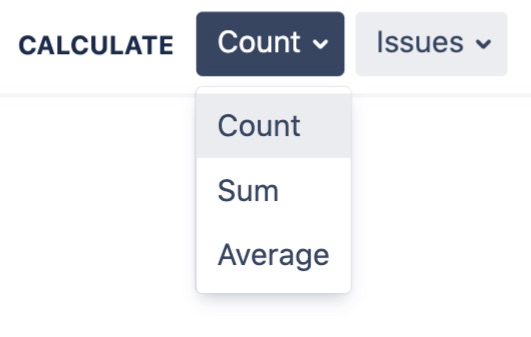
Next, select your Chart By option from the drop-down list and choose a Calculate option
⠀
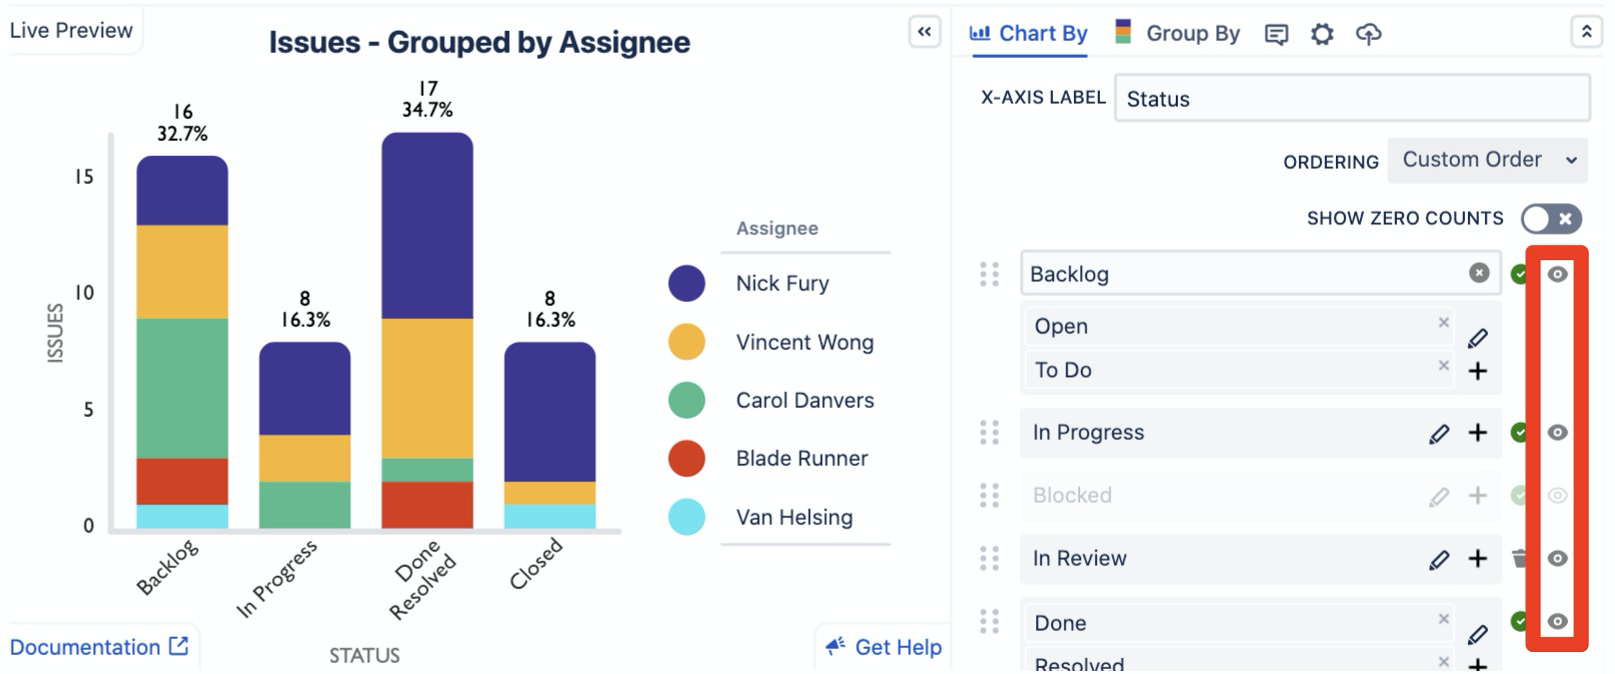
Customize the segment order and colors of your charts
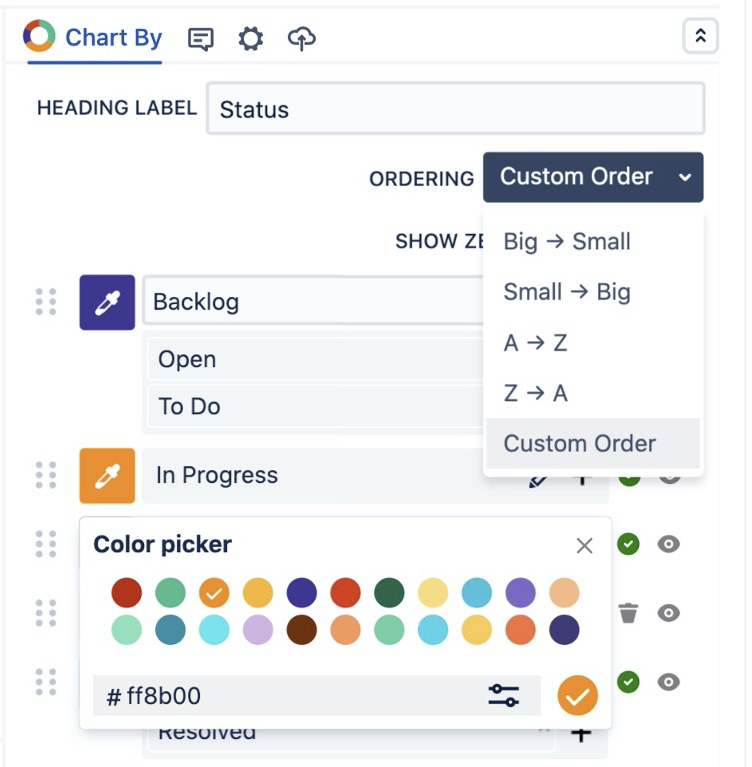
⠀
The show/hide selector allows you to hide segments that you don't want to display on your charts
⠀
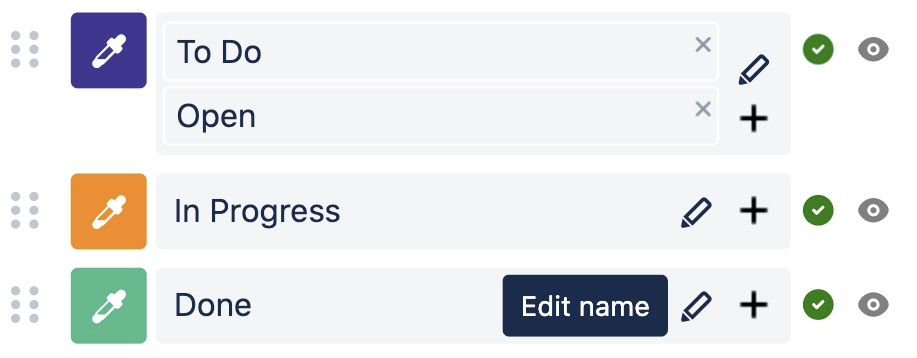
Edit the name of any segments using the pencil icon that appears when you hover over an option
⠀
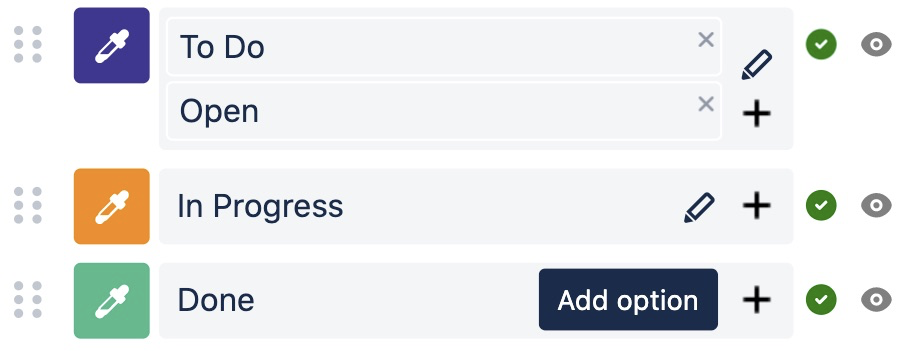
Merge multiple options into a single segment using the plus icon next to each segment
⠀
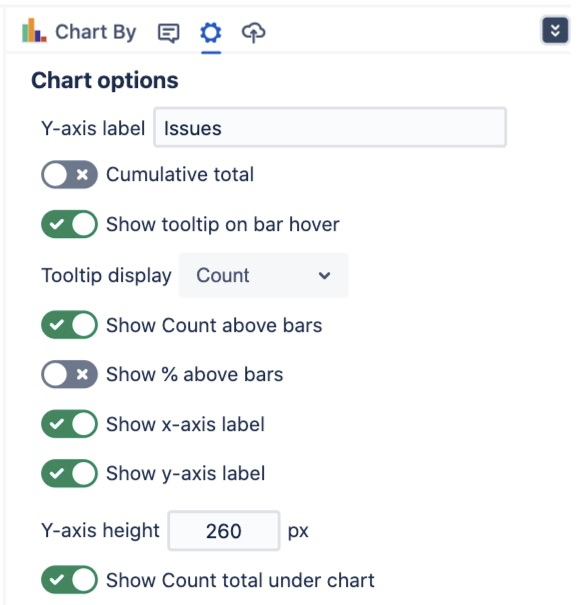
Use the Display Options to further customize your charts
For even more customization of your charts use Chart By Custom JQL or Saved filters
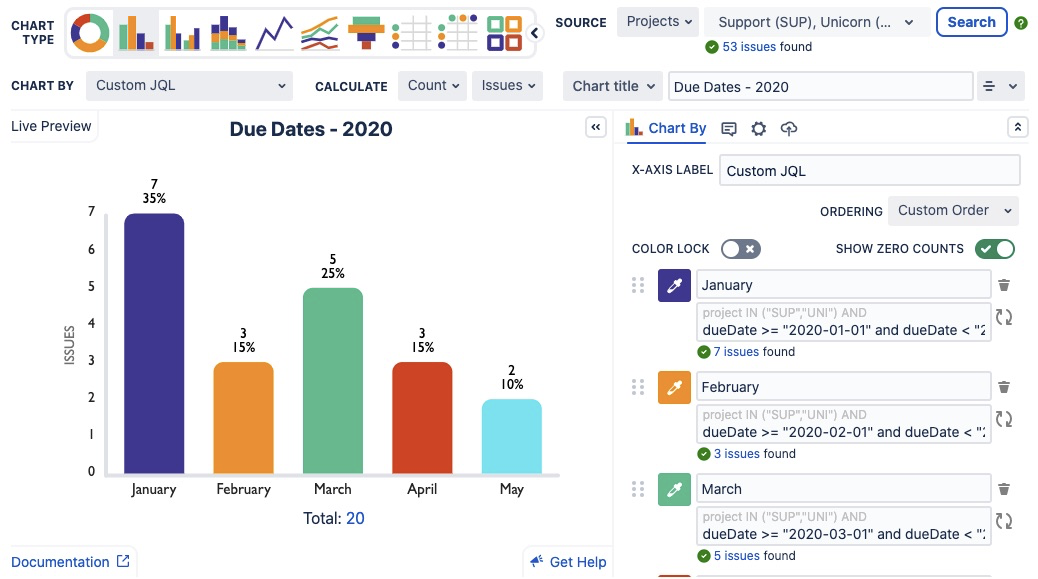
Each segment is now an individual JQL search which means you can chart by anything that you can write a JQL search for!
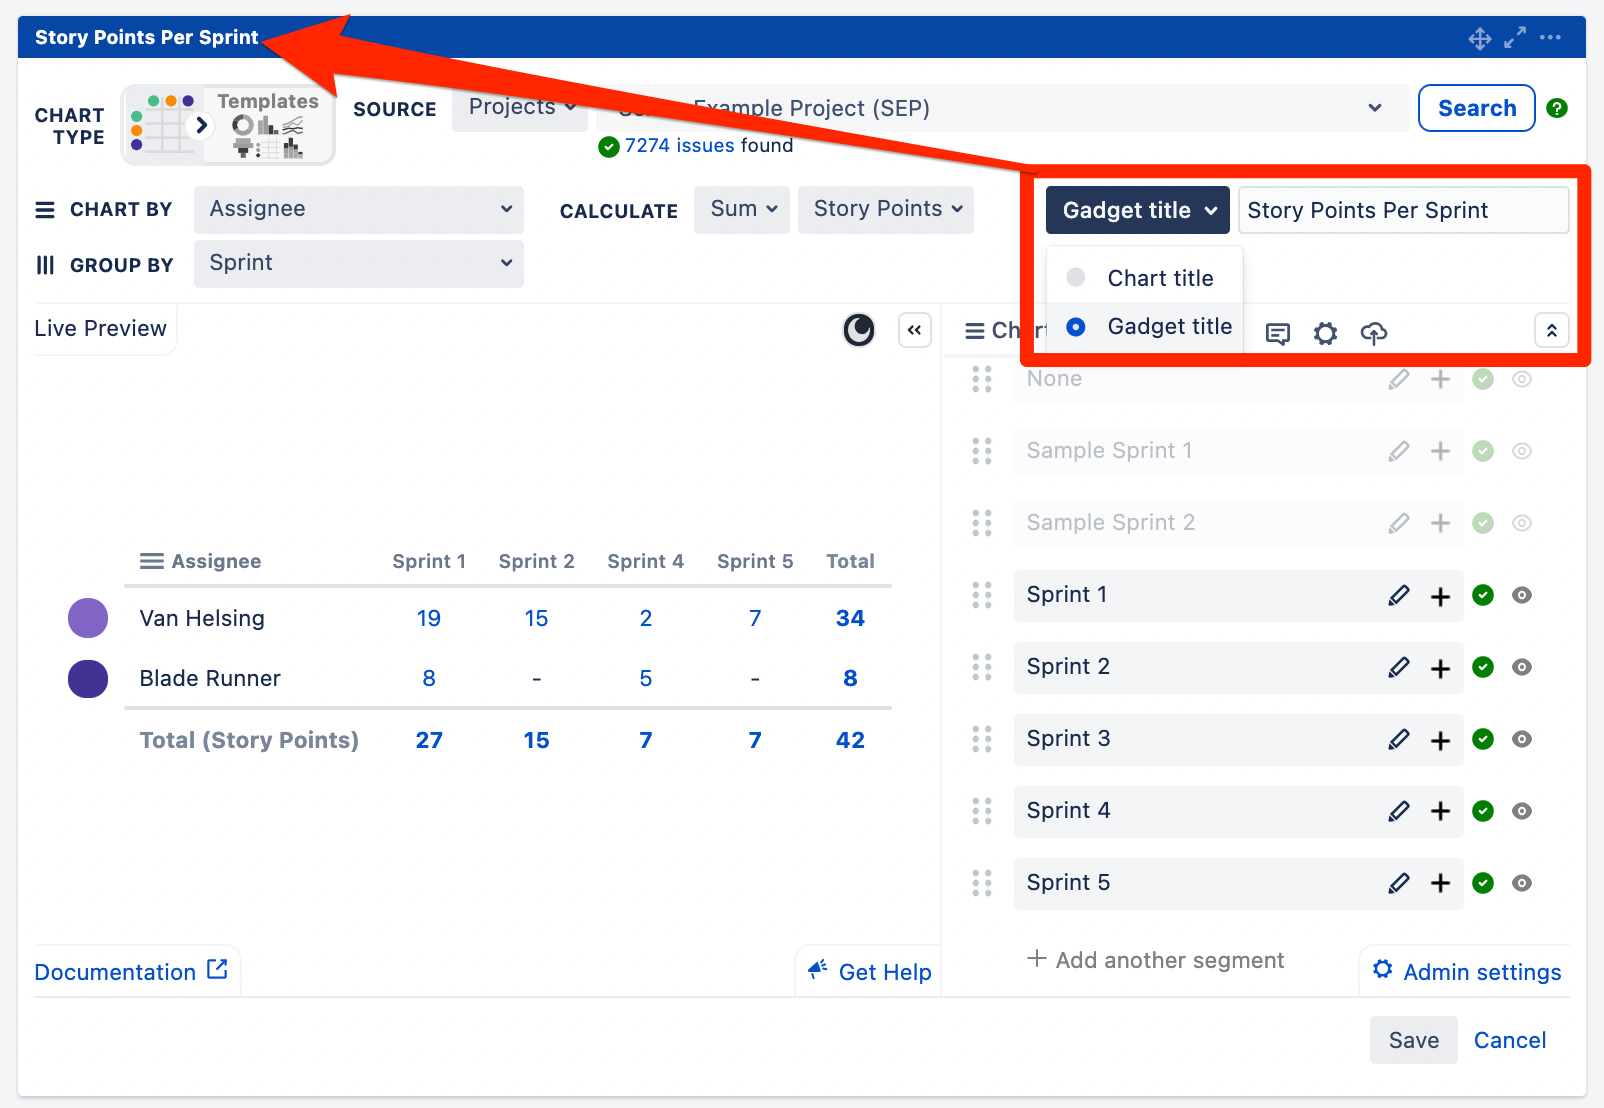
Titles can be added to individual charts - for Server and Data Center charts you can select whether the title appears in the gadget title or inside the chart