 Custom Jira Charts for Confluence
Documentation
Available platforms
| Confluence Platform | Availability | Supported Versions |
|---|---|---|
| Cloud | Latest | |
| Server | Unable to render {include} The included page could not be found. - Unable to render {include} The included page could not be found. | |
| Data Center |
Unable to render {include} The included page could not be found. - Unable to render {include} The included page could not be found.
|
Pricing
App Playground - Demo
Get Custom Jira Charts for Confluence
Start your 30-day free trial of Custom Jira Charts for Confluence from the Atlassian Marketplace or directly on your Confluence instance by going to "Find new apps". Only Administrators can install apps on Confluence.
The installation process will be slightly different if you're using Confluence Cloud, Server, or Data Center. Here are step-by-step guides for both:
User Guide
Custom Jira Charts for Confluence has identical functionality on Cloud, Server and Data Center.
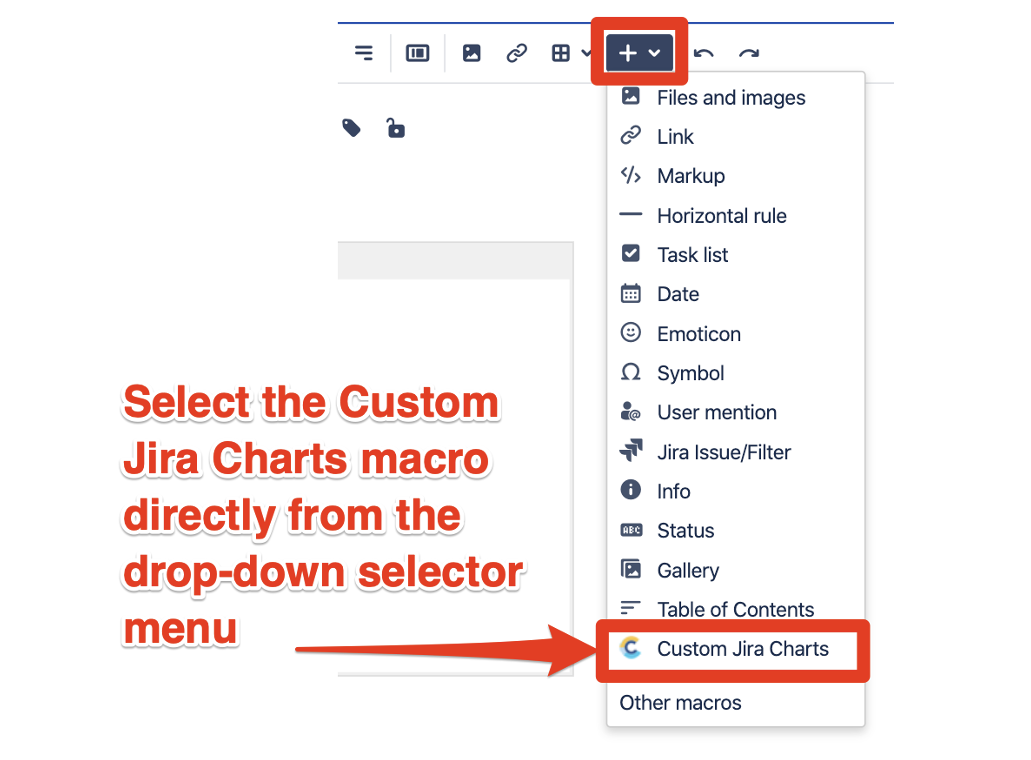
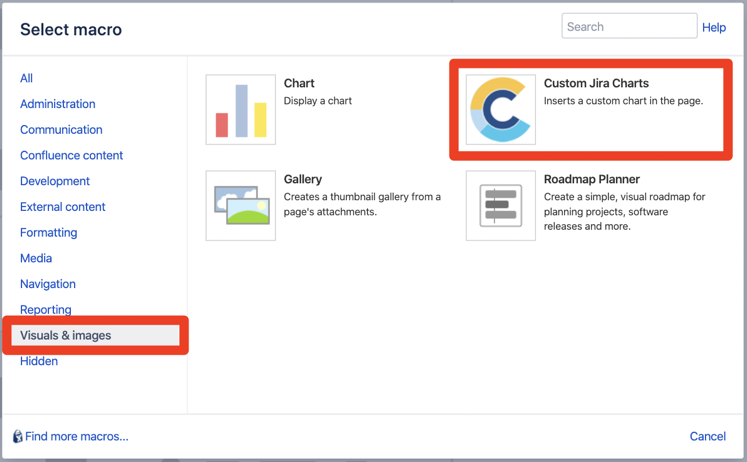
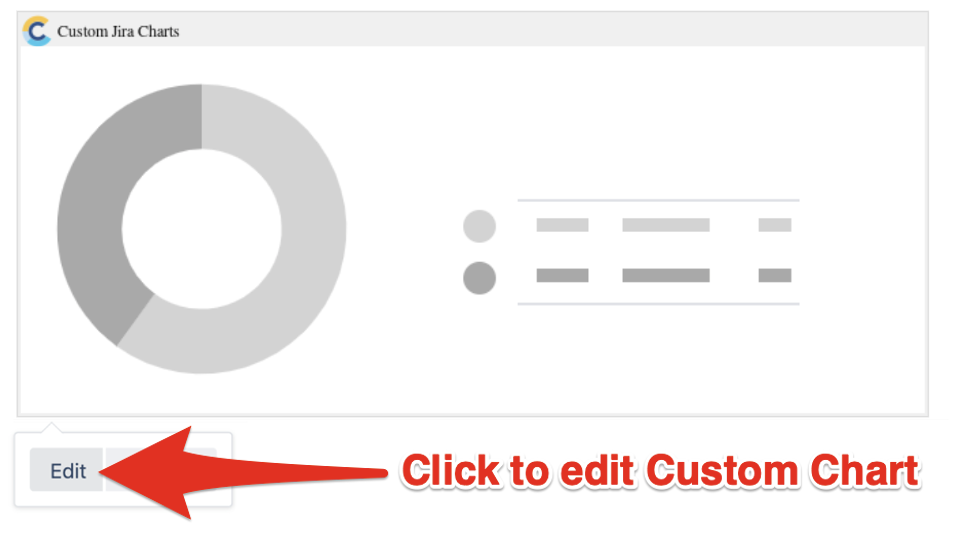
Insert the Custom Jira Charts macro on a Confluence page
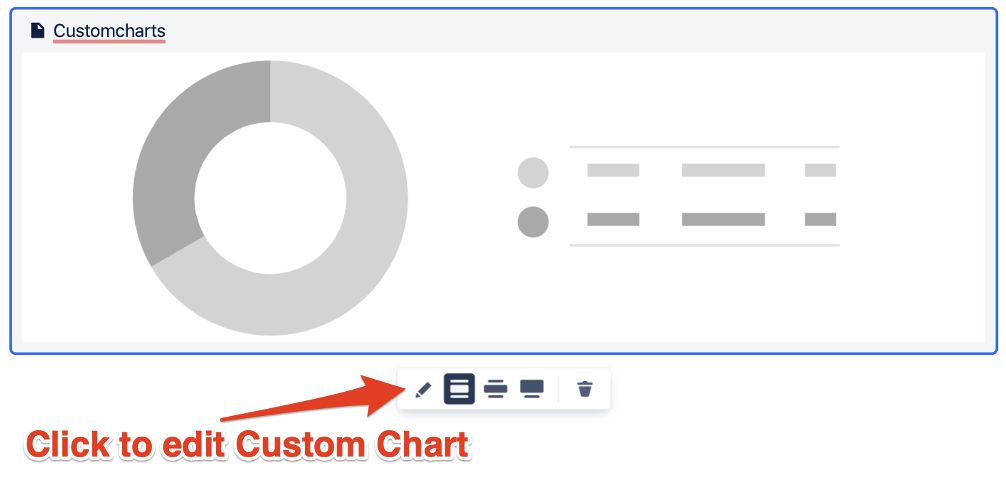
Click on the Custom Jira Charts macro to open the editor
| Cloud Editor | Server & Data Center Editor |
|---|---|
|
|
⠀
Start by selecting a Project, Saved filter or JQL query into the Source input to find your issues
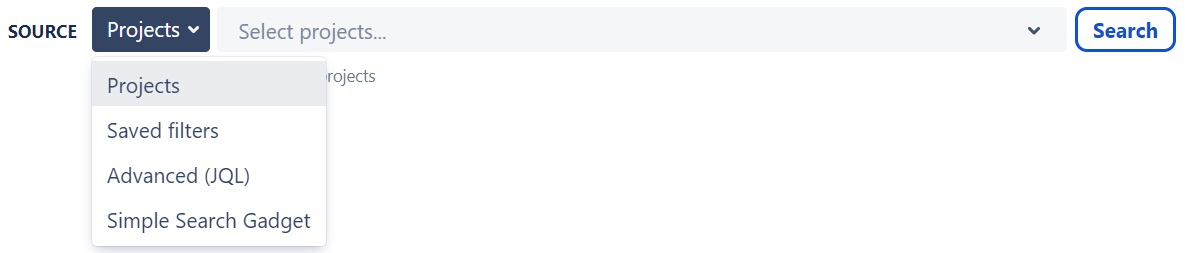
If you need some help writing your JQL query check out our quick getting started guide
Try using a Simple Search macro to to share a dynamic filter across multiple Custom Charts
⠀
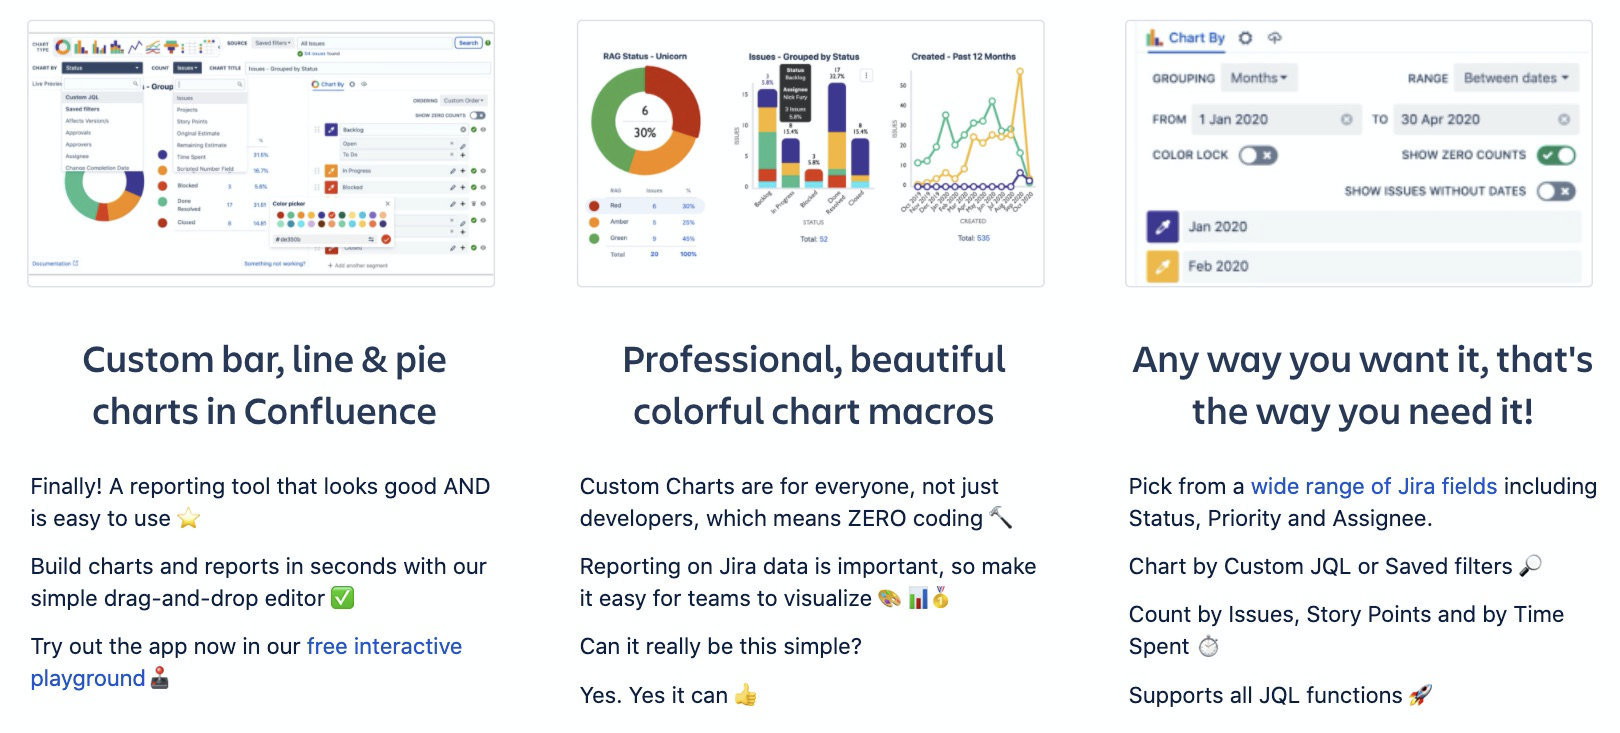
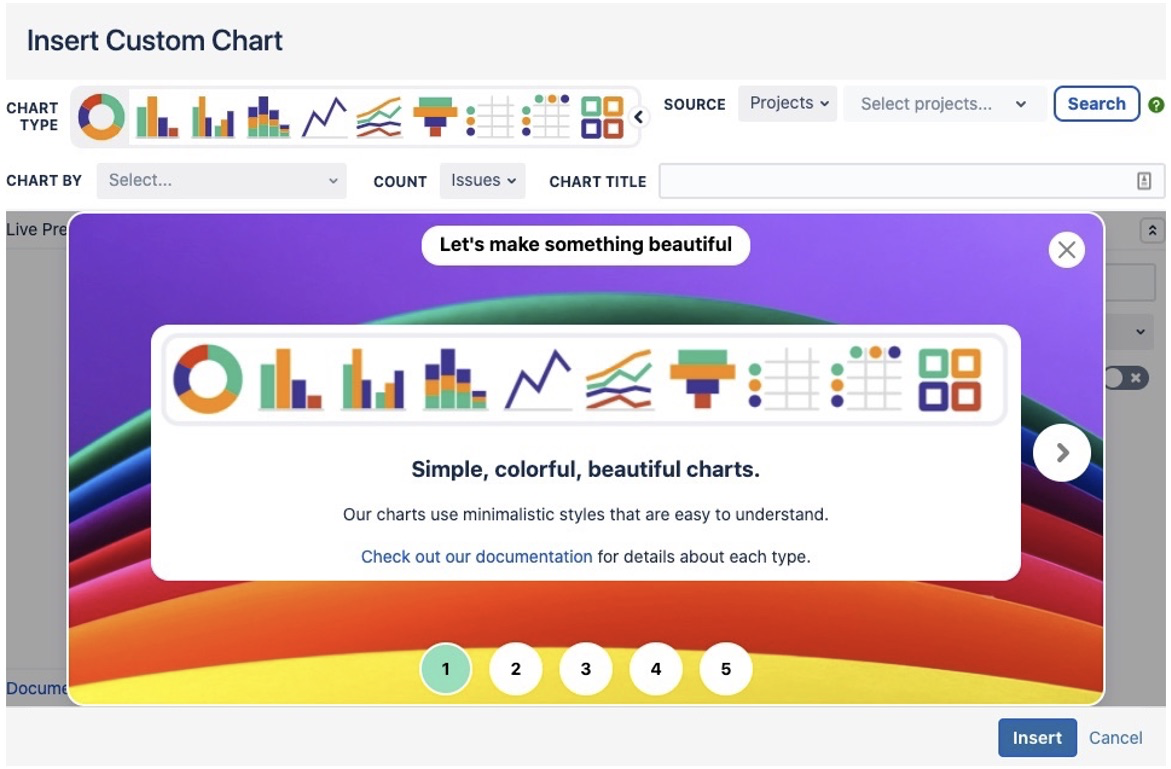
Choose from a wide range of Chart Types

⠀
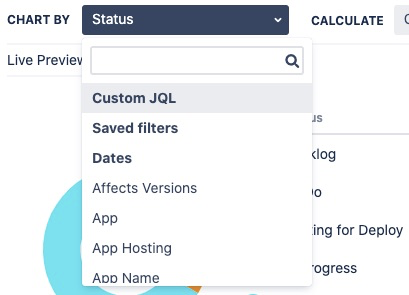
Next, select your Chart By option from the drop-down list and choose a Calculate option

⠀
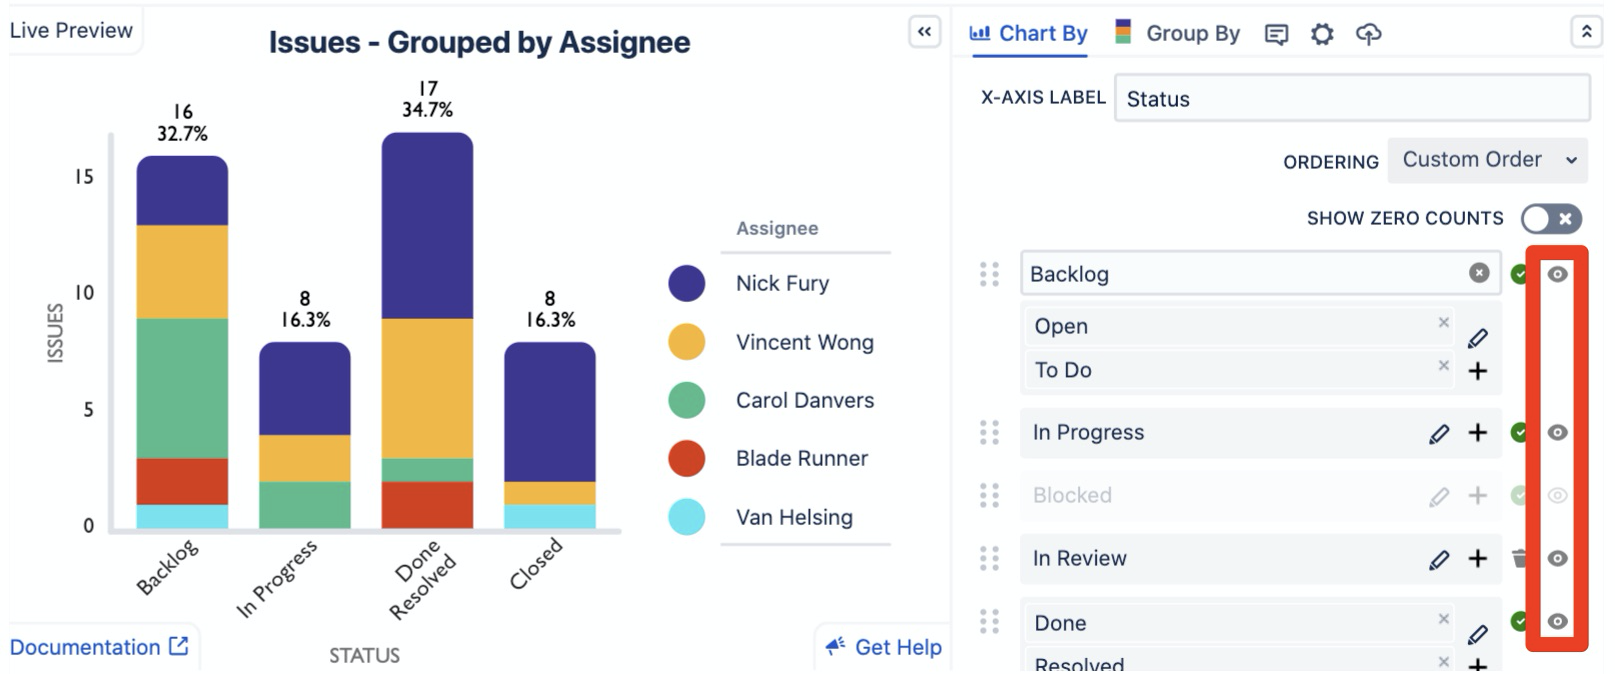
Customize the segment order and colors of your charts
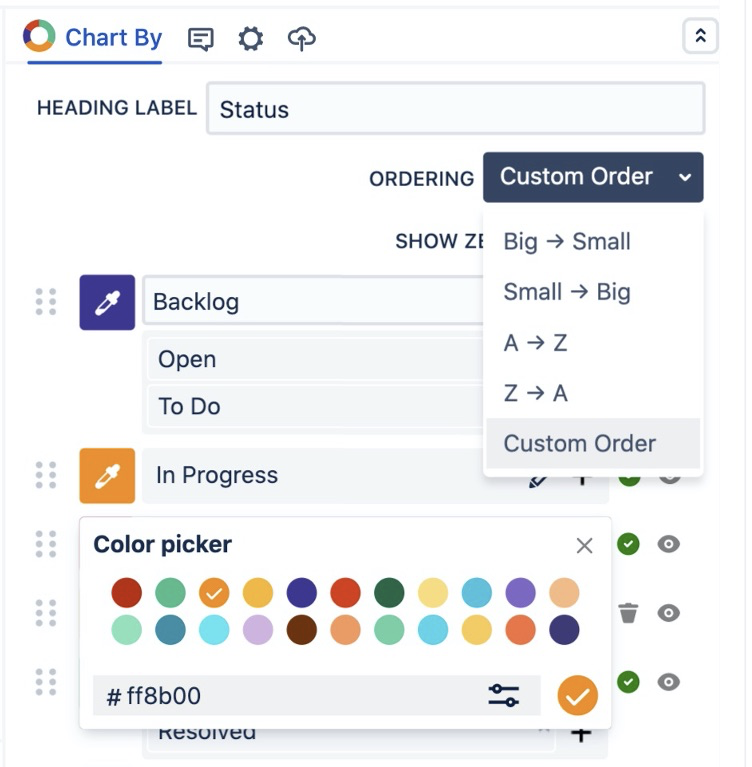
⠀
The show/hide selector allows you to hide segments that you don't want to display on your charts
⠀
Edit the name of any segments using the pencil icon that appears when you hover over an option
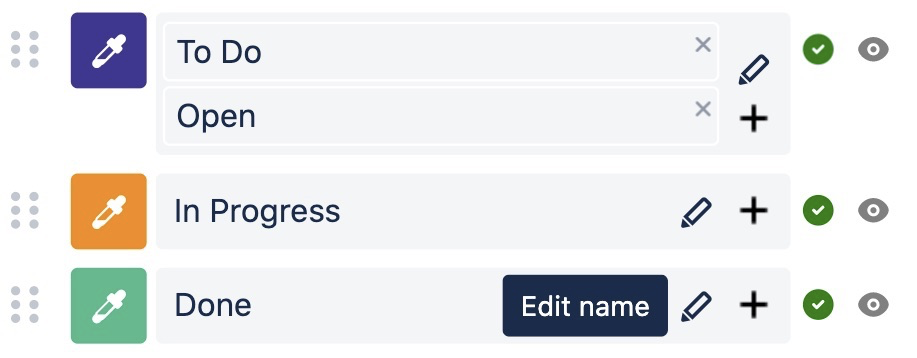
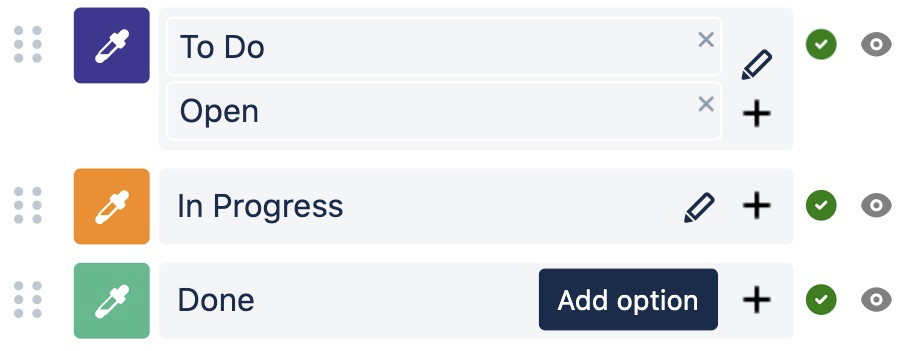
Merge multiple options into a single segment using the plus icon next to each segment
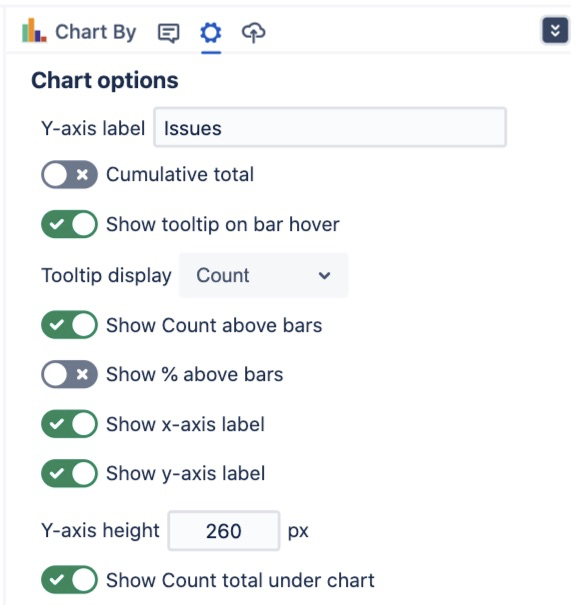
Use the Display Options to further customize your charts
For even more customization of your charts use Chart By Custom JQL or Saved filters
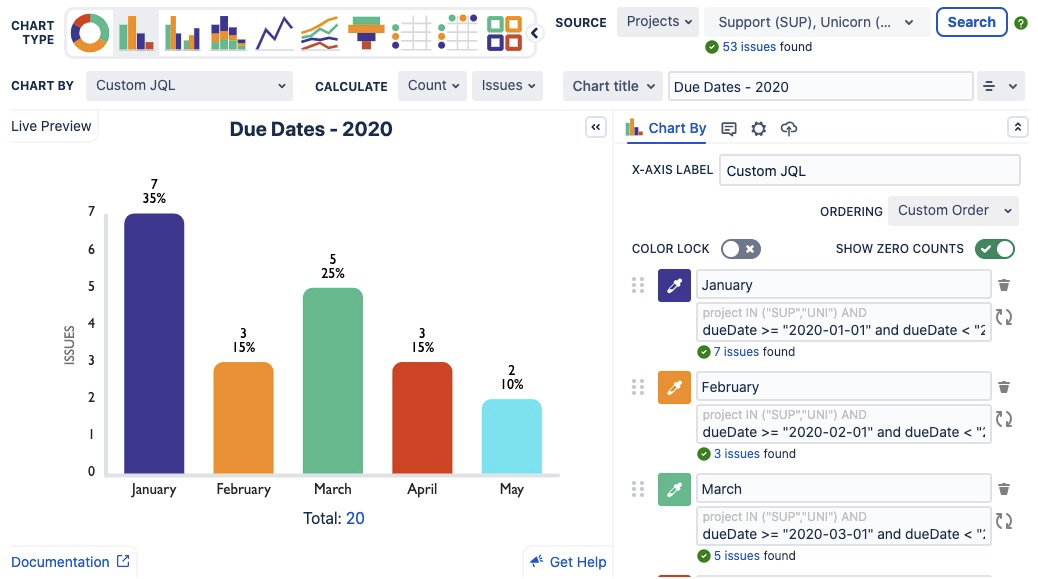
Each segment is now an individual JQL search which means you can chart by anything that you can write a JQL search for!
Get Help and Support
Unable to render {include} The included page could not be found.
Unable to render {include} The included page could not be found.
Unable to render {include} The included page could not be found.