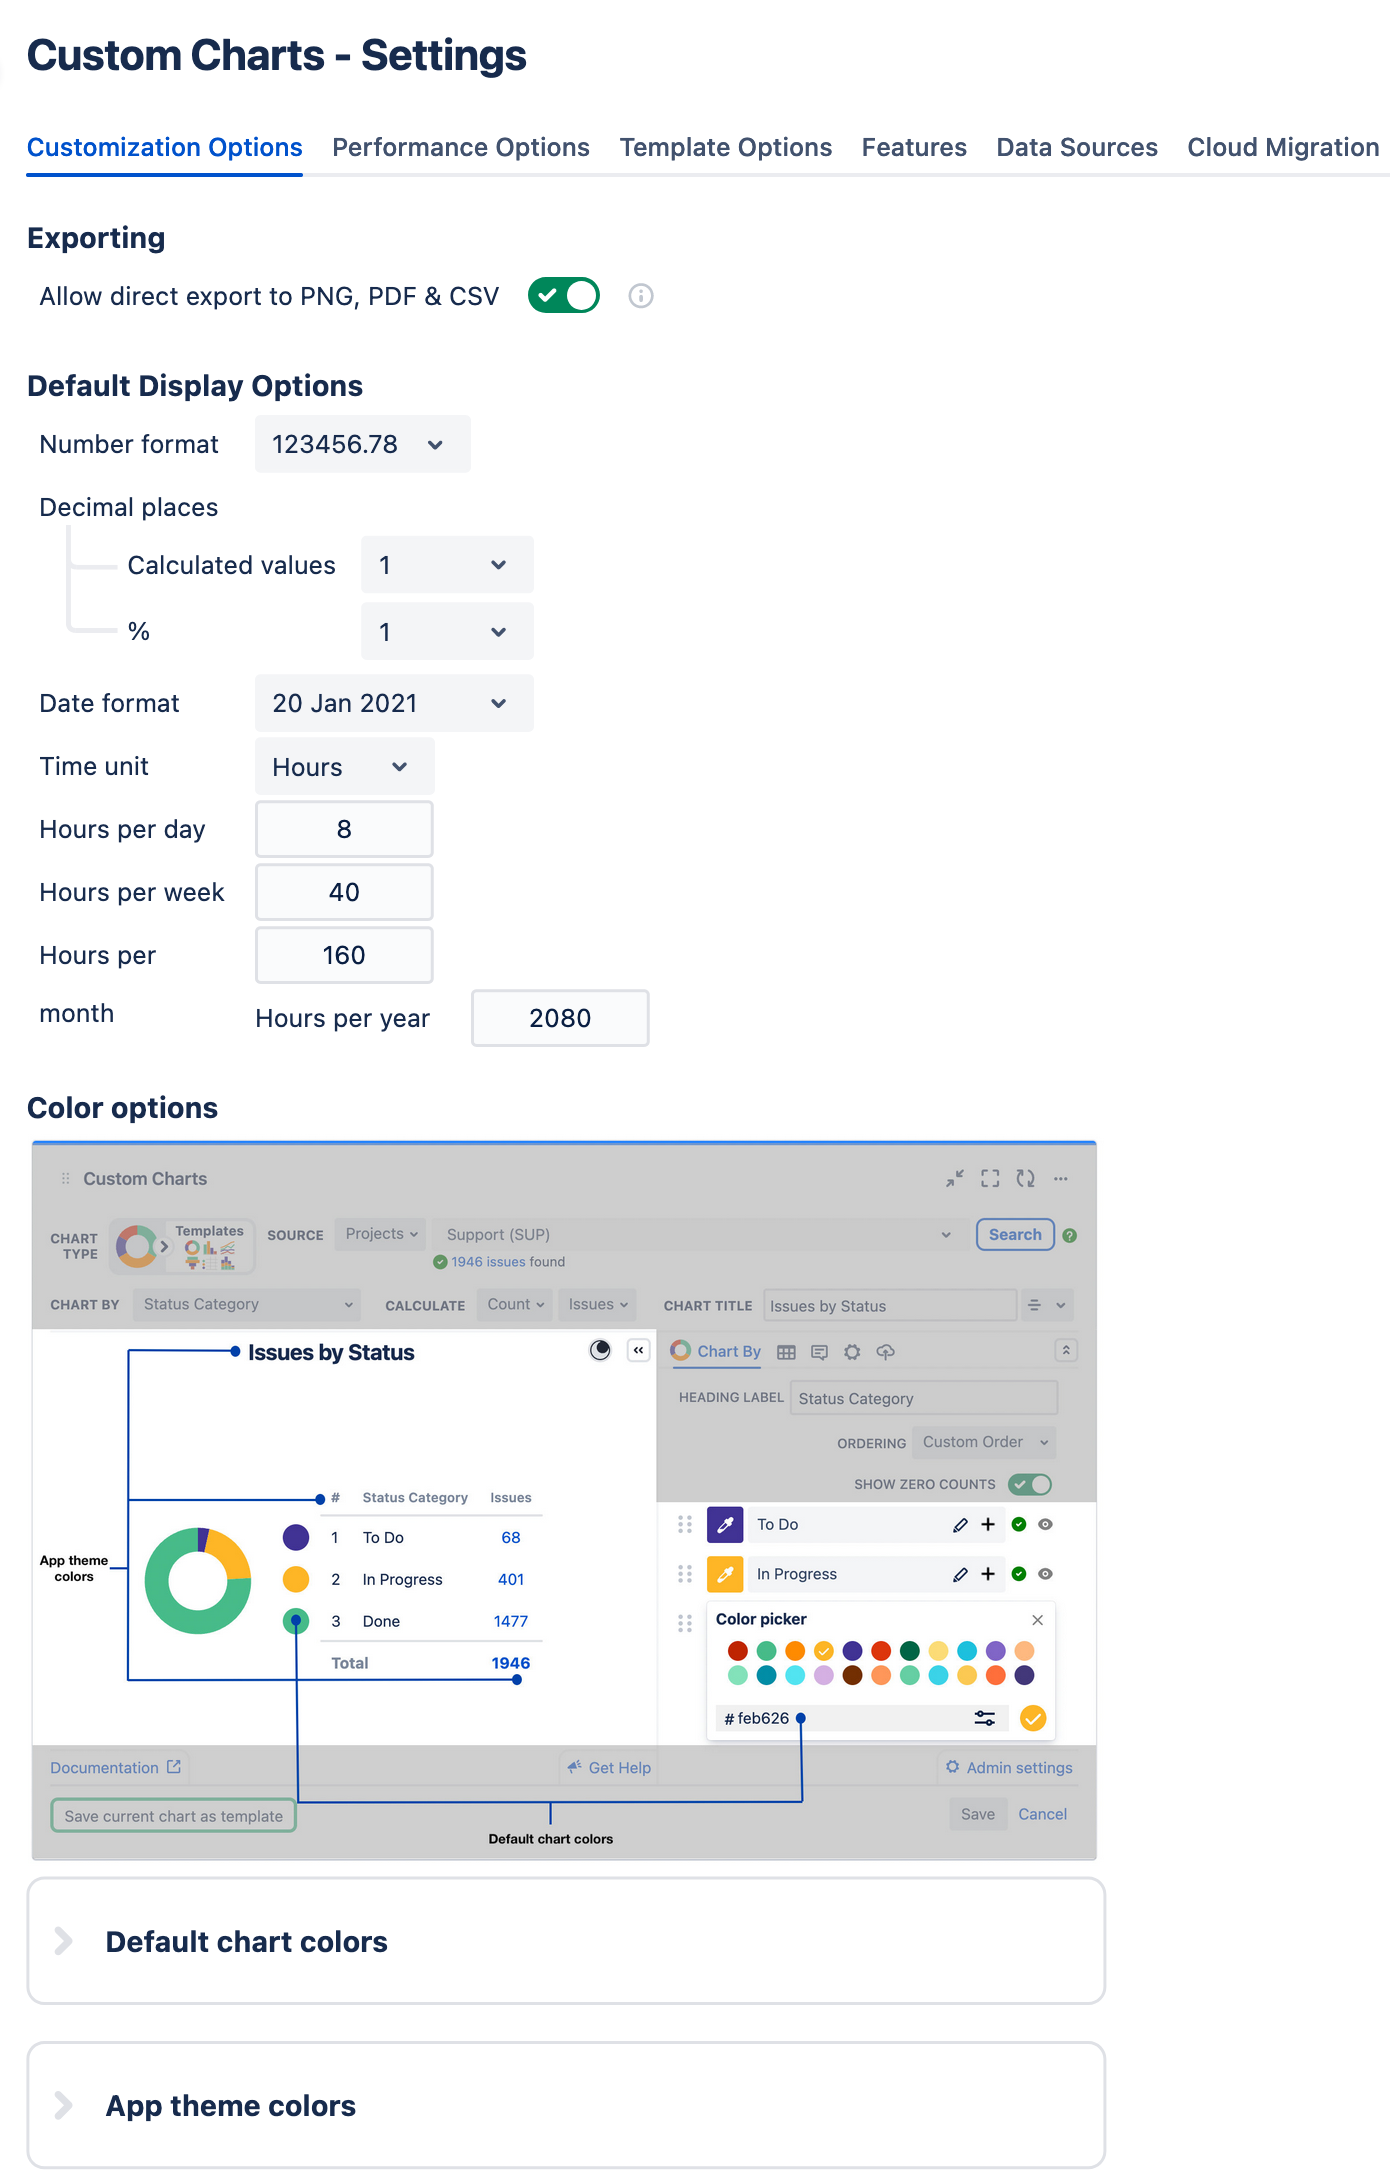
The customization options tab allows administrators to set the default display settings for all charts.
We believe in accessibility and making our apps as inclusive as possible.
The selection of colorblind accessible colors was sourced from https://davidmathlogic.com/colorblind
As a number of our team members are colorblind we have found this to be a very useful feature ![]()
If you have any questions or feedback please contact us.
Exporting section | ||
|---|---|---|
| Customization | What does it do? | |
| If toggled on (green), chart viewers can export Custom Charts gadgets to a PNG, PDF, or CSV file. If toggled off (grey), the feature is disabled and chart viewers will not be able to export gadgets. | |
Default Display Options section | ||
| Customization | What does it do? | |
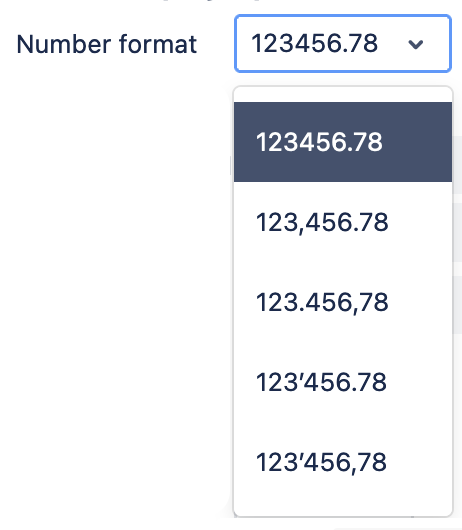
| The "Number format" dropdown allows Jira admins to set a default format for all numbers displayed in Custom Charts. | |
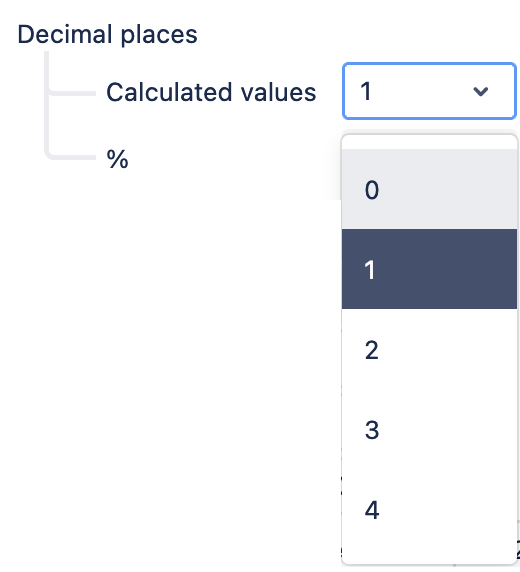
| The "Calculated values" dropdown allows Jira admins to set decimal place formats for number calculations displayed in Custom Charts. If "0" is selected, the gadget will round to the nearest decimal point. Example:
The "%" dropdown has the same functionality, except it is is specifically for percentages displayed on a chart. The dropdown has the same options as the "Calculated values" dropdown (0,1,2,3,4). Example:
| |
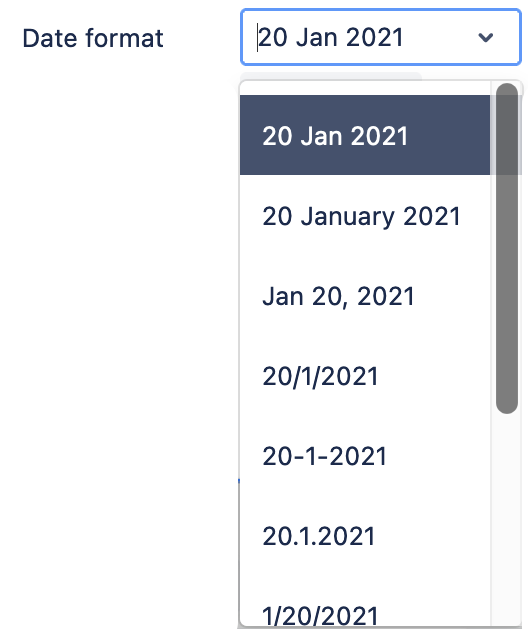
| The "Date format" dropdown allows Jira admins to set formats for all Dates displayed in Custom Charts. | |
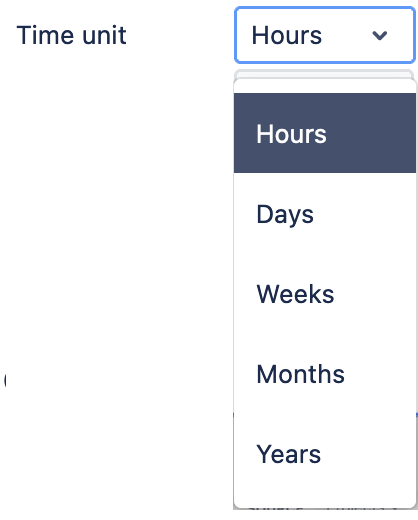
| The "Time unit" dropdown allows Jira admins to set formats for all Time values displayed in Custom Charts. Example:
| |
| The "Hours per day" number field allows Jira admins to set the amount of working hours in a business day. The default is 8 hours, but if your organization works on a 4 day work week, this number can be adjusted to 10 hours, for example. | |
| The "Hours per week" number field allows Jira admins to set the amount of working hours in a business week. The default is 40 hours. | |
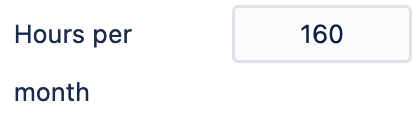
| The "Hours per month" number field allows Jira admins to set the amount of working hours in a month. The default is 160 hours. | |
| The "Hours per year" number field allows Jira admins to set the amount of working hours in a year. The default is 2080 hours. | |
Color options section | ||
| Customization | What does it do? | |
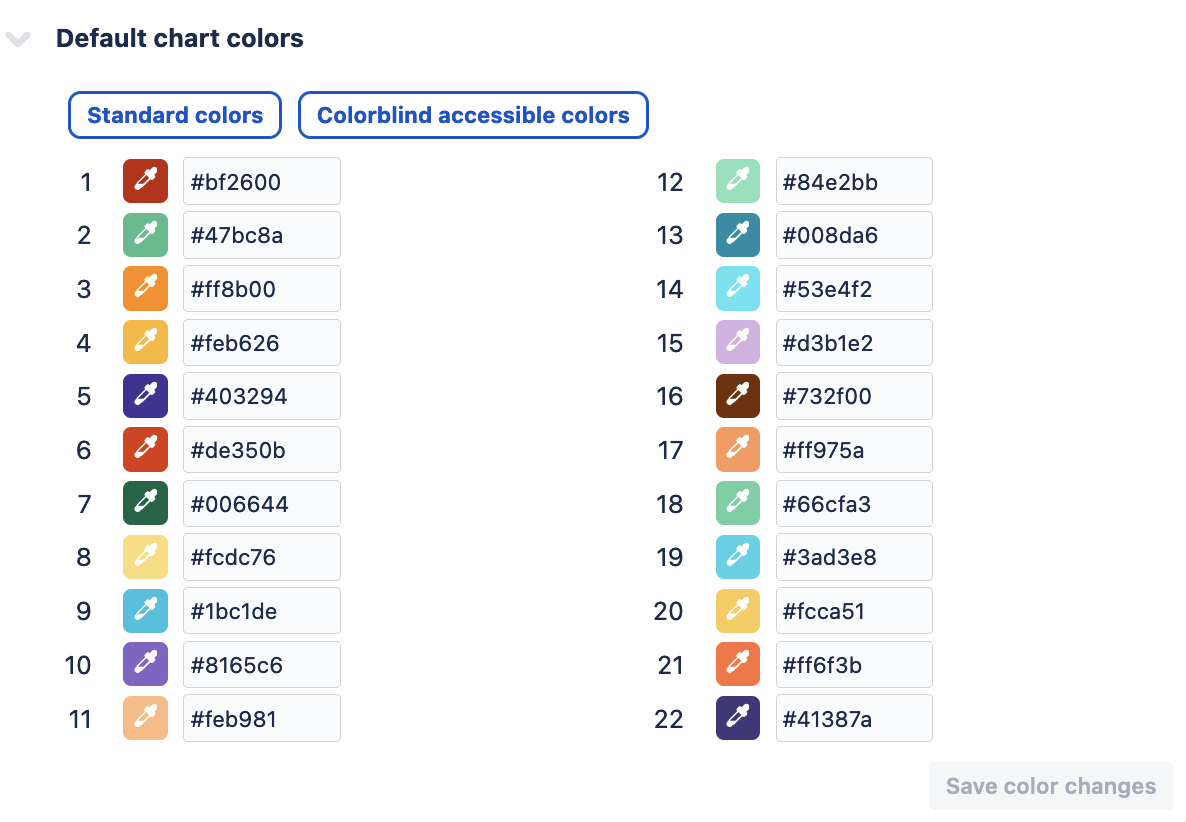
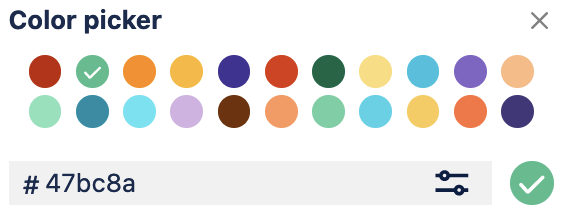
| Each number in the "Default chart colors" section represents a slot in the Color picker that can be used in Custom Charts gadgets to adjust chart segment colors (displayed below). There are 22 slots in the color picker that can be customized. In the Customization Settings, Jira admins can adjust any chart default colors by either entering the hex code of the desired color, or, by using the eyedropper icon next to the slot number and selecting the color. If modifications are made, users will see | |
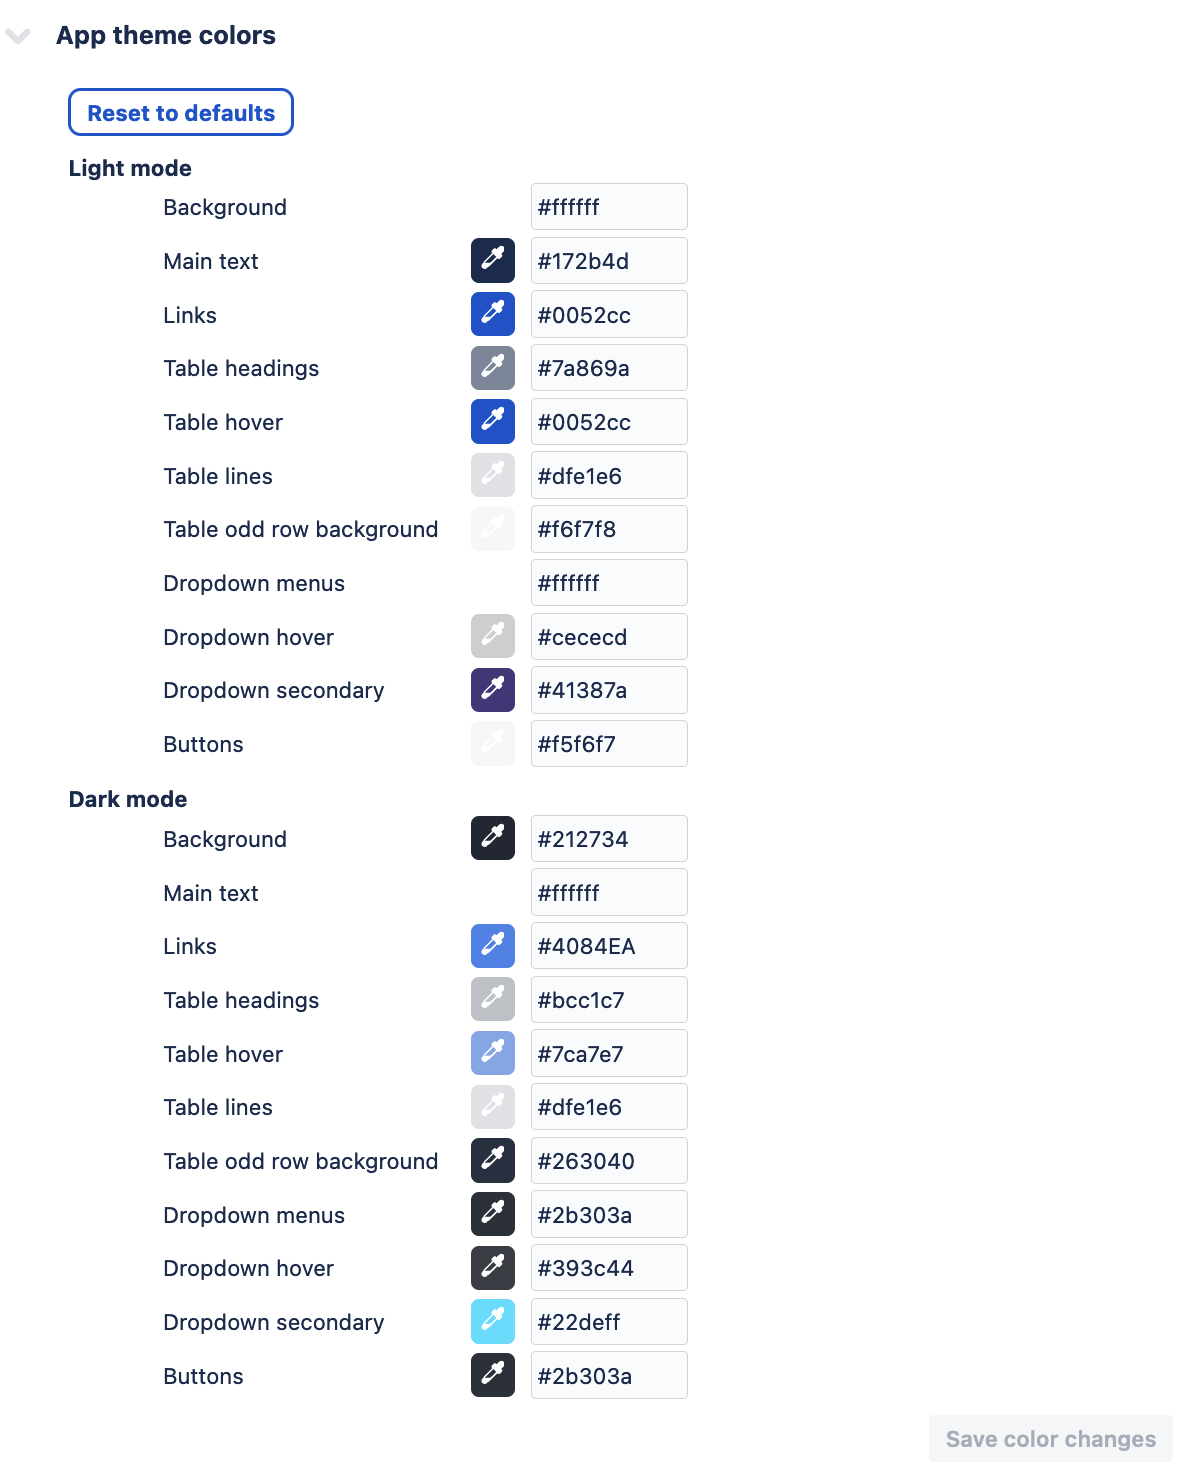
| In the App theme colors section, Jira admins can adjust the colors used when Custom Charts gadgets are in "Light mode" and "Dark mode". If modifications are made, users will see | |