incl
The Calculate options select how the data is displayed on the charts
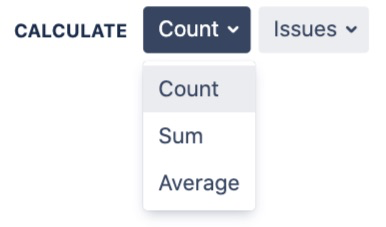
| Count | Displays the number of Issues or Projects found |
|---|---|
| Sum | Aggregates all the values found Example: 10 Story Points + 20 Story Points = 30 Story Points |
| Average | Takes the Sum and Divides by Issue Count Example: 30 Story Points ÷ 2 issues = 15 Average Story Points per Issue |
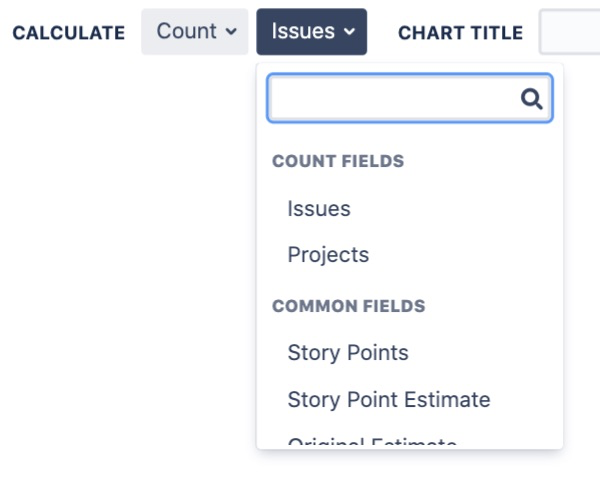
Any Number field will be selectable on the field list
The calculated value is shown as a column in the legend table, the y-axis label on bar charts, and the calculated %
Scripted and calculated fields from Jira add-ons (e.g. ScriptRunner or JMCF) can also be used as a Count value, as long as they are number fields.
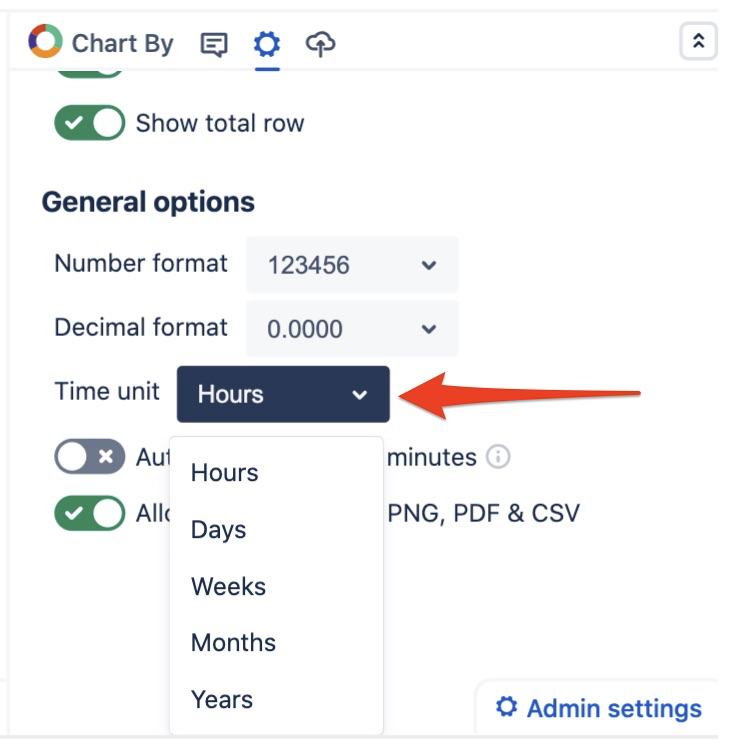
For calculations involving time logs, the default time unit is hours and can be changed to days, weeks, months, or years
⠀


Old Street Solutions Ltd. © 2021