Skip to end of metadata
Go to start of metadata
You are viewing an old version of this content. View the current version.
Compare with Current
View Version History
« Previous
Version 5
Next »
Standard Field Options
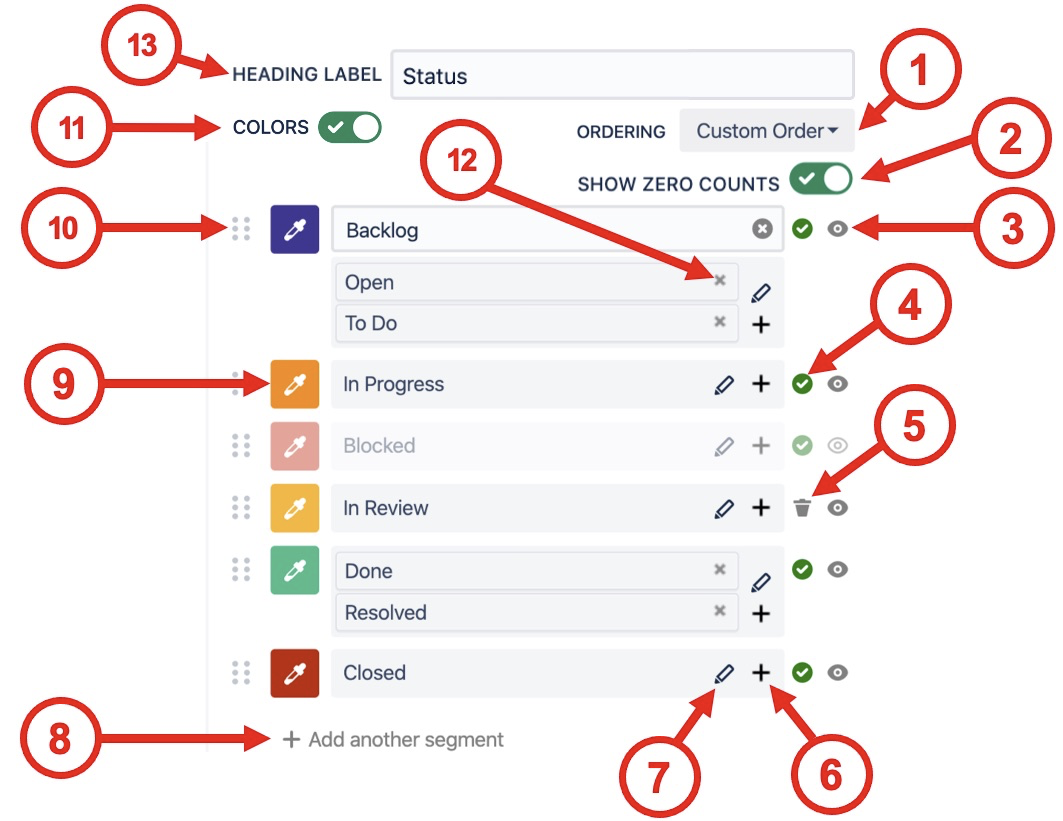
| Option | Description |
|---|
| 1 | Segment ordering | Orders segments by the value of their Counts or Names. Custom order is arranged by the user with the drag-and-drop interface. 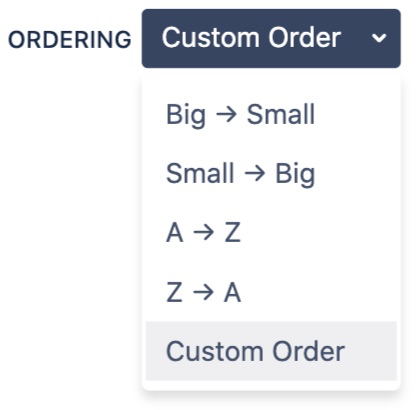
|
|---|
| 2 | Show zero counts | If the count value is zero for a segment use this selector to hide it from the chart. |
|---|
| 3 | Show / hide segments | If issues have been found for a segment then it cannot be deleted, but it can easily be hidden using show / hide segment button. 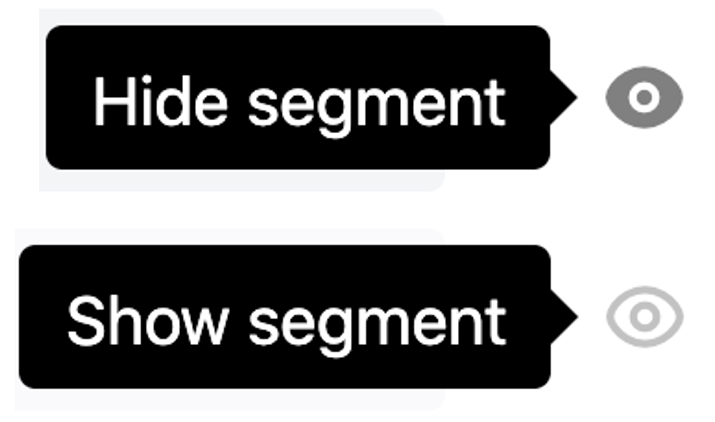
|
|---|
| 4 | Issues found indicator | A green tick indicates that issues have been found for the current segment. Hovering over the indicator shows a tooltip with the number of issues found. 
|
|---|
| 5 | Delete segment | When zero issues are found for a segment it can be deleted. 
|
|---|
| 6 | Add additional values | Clicking the + opens a drop-down menu to pick additional values. Values already in use in other segments have the suffix (Used option). If a used option is selected it will be moved into the currently selected segment. 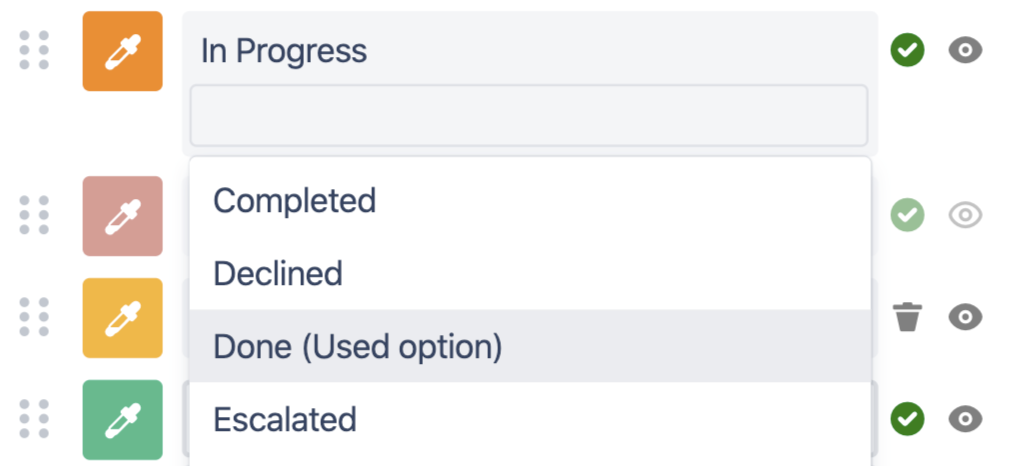
|
|---|
| 7 | Rename segment | Clicking the pencil button opens the "Name segment" input box. 
The original segment values are displayed as a tooltip when hovering over the new name in the legend table. 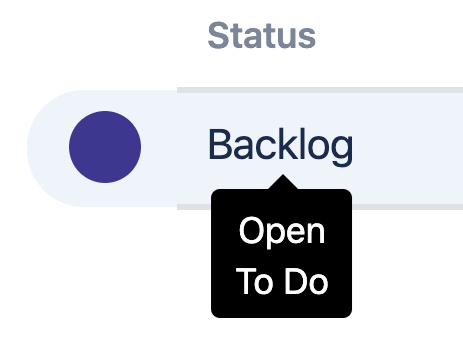
|
|---|
| 8 | Add another segment | If a value has not been found in the current search (e.g. you're making a template chart) then you can add additional segments. This allows you to select the colors, name and order of appearance even before any issues have been found. 
|
|---|
| 9 | Color picker | Pick from a color palette of 22 default options or use a custom hex code to get exactly what you need. 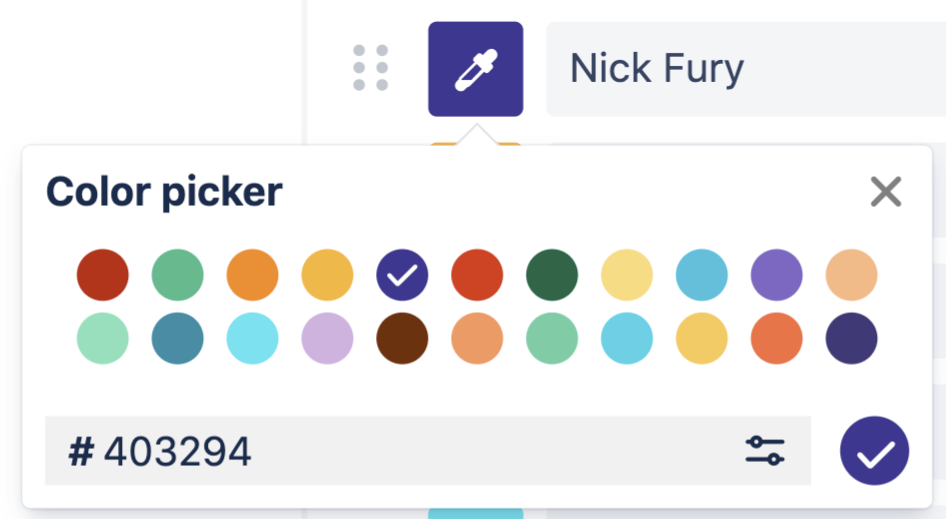
For even more customization select from a full-colour palette 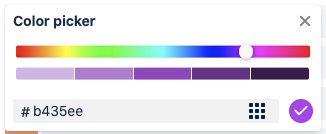
|
|---|
| 10 | Drag-and-drop | Drag-and-drop to reorder segments. 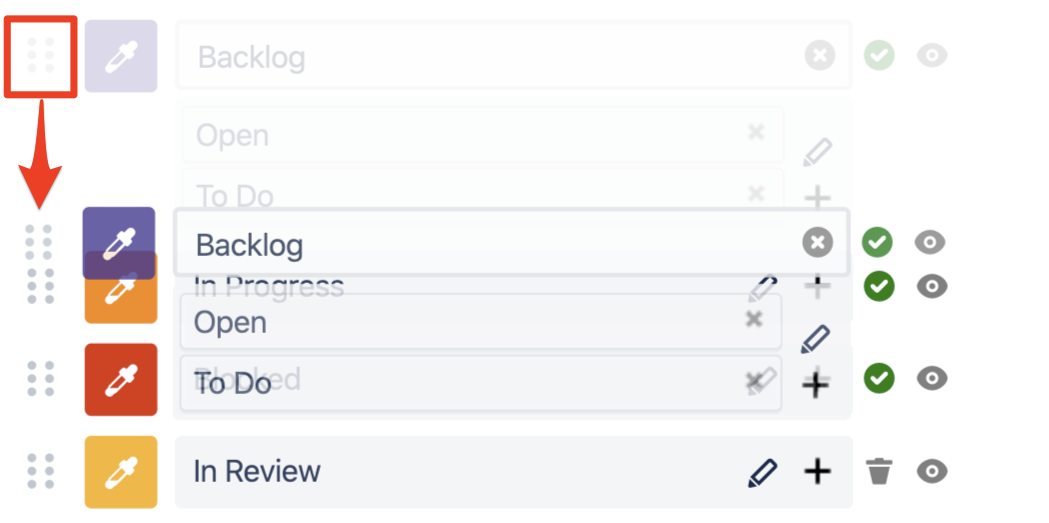
When a segment is manually moved the ordering selector changes to Custom Order. 
|
|---|
| 11 | Colors | Disable colors to hide the colored dots on the table. 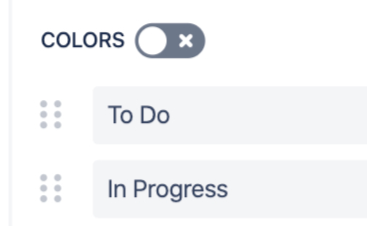
|
|---|
| 12 | Split segments | When additional values have been added to a segment, they can be split out using the small x in the top right corner of the option input. |
|---|
| 13 | Heading label | Customize the heading label for the Chart By and Group By values. |
|---|
Date Field Options
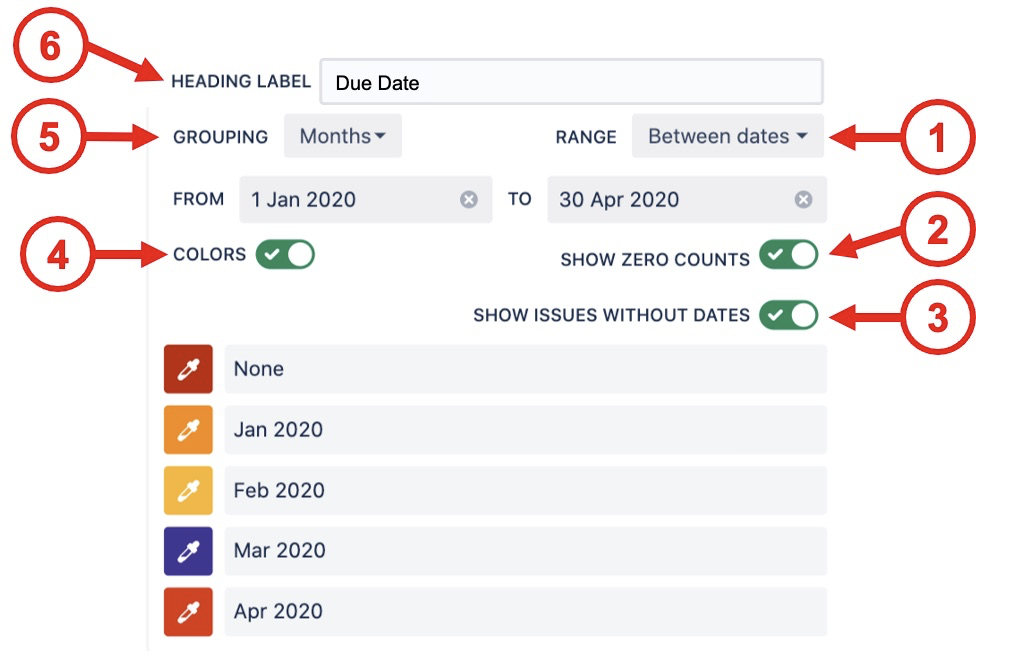
| Option | Description |
|---|
| 1 | Range | - Past 24 hours
- Past 3 days
- Past 7 days
- Past 30 days
- Past 90 days
- This week
- This month
- This quarter
- This year
- Last week
- Last month
- Last quarter
- Last year
- Dynamic range
- Between dates
- All dates
|
|---|
| 2 | Show zero counts | If the count value is zero for a segment use this selector to hide it from the chart. |
|---|
| 3 | Show issues without dates | For date fields that can be empty (e.g. due date) this selector shows those issues as a None segment at the start of the range. This is very useful to catch issues that do not have a date set. 
|
|---|
| 4 | Colors | Disable colors to hide the colored dots on the table. 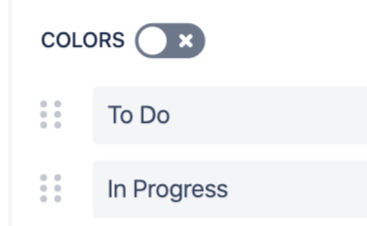
|
|---|
| 5 | Grouping | - Hours
- Days
- Weeks
- Months
- Quarters
- Years
|
|---|
| 6 | Heading label | Customize the heading label for the Chart By and Group By values. |
|---|
Custom JQL / Saved filters Options
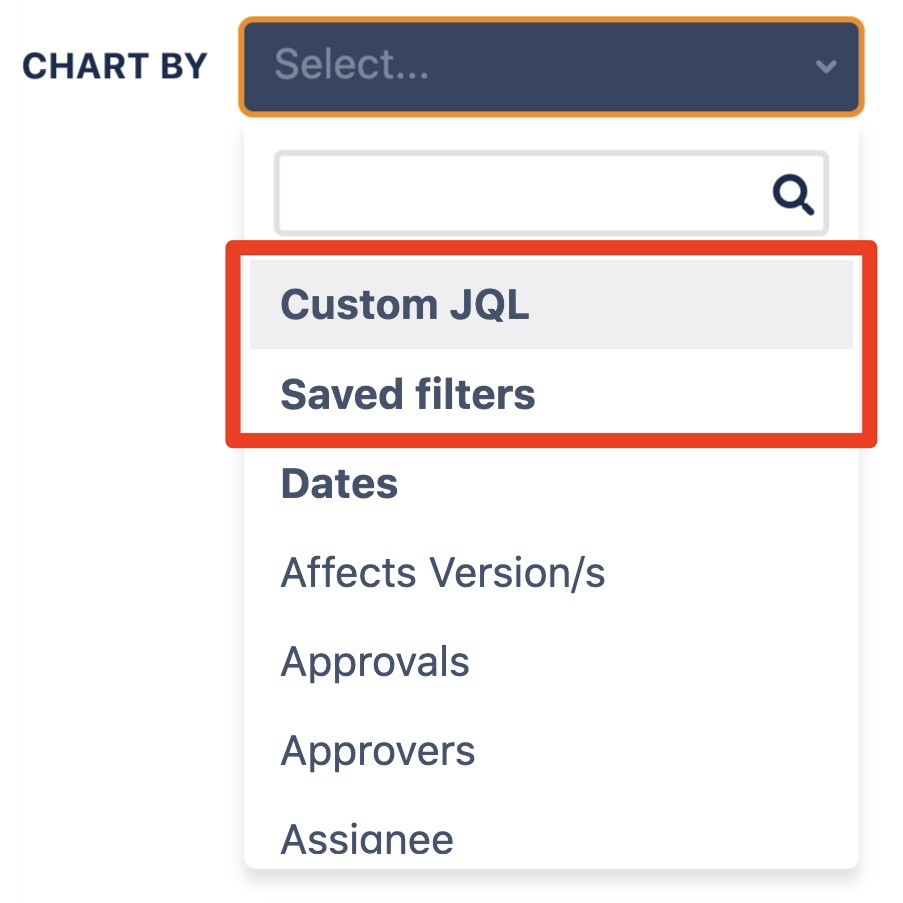
To create fully custom charts you can use the advanced options Custom JQL or Saved filters to create segments.
Display Options

| Show legend | Displays the Group By value legend |
|---|
| Show tooltip on bar hover | Shows a tooltip for individual segments when hovering over the bars |
|---|
| Show count above bars | Displays the count value above the bars. When the bars are very thin this value is hidden and only shown on hover. |
|---|
| Show x-axis label | Displays the x-axis label which is taken from the chart by field name |
|---|
| Show y-axis label | Displays the y-axis label which is taken from the count field name |
|---|
| Show count total under chart | Displays the total count link below the chart. |
|---|
| Auto refresh every <x> | When selected, the chart data will automatically refresh at the time interval set in the Custom Charts admin settings. |
|---|
Show chart border
(Confluence only) | Displays a border around the Confluence macro. |
|---|